


Being well-informed about indicators is one of the trading essentials to pull ahead in financial markets. There’s a realm where exist some of the best technical indicators, such as the Stochastic Oscillator, Moving Average Convergence Divergence, Relative Strength Index (RSI), etc. True Strength Index (TSI) is another indicator that certainly adds to this list, considering its performance, which exceeds those of the above.
While True Strength Index has a lot of applications, professional traders use it to measure the strength of a trend. TSI is more effective at trade management than in issuing entry signals.
True Strength Index is, in essence, a momentum indicator. However, because exponential moving averages are used as a smoothing factor in the TSI computation, the TSI indicator can predict whether the current trend will persist or change.
With this knowledge, you can quickly determine whether to maintain holding onto your profitable deals or sell them for a profit.
This article will cover the True Strength Index in detail and how to use it in trading.
What is the True Strength Index (TSI)?
The True Strength Index is a momentum indicator that was developed by William Blau in the early 90s. He introduced it in the then-famous Stocks and Commodities magazine.
As with other oscillators, True Strength Index can detect, visualize or confirm the strength of a trend. To accomplish this, it oscillates between positive and negative territory while pointing out prospective trends and trend alterations through crossovers. Positive describes the increased control of the buyers, while negative describes the increased control of sellers.
It is based on Exponential Moving Average (EMA). EMA is a moving average that imparts more weight to the latest prices. True Strength Index deploys three EMAs: two 13-period EMAs and one 25-period EMA. The EMAs are smoothened to provide a price direction that is in line with the current market trend. Smoothening is accomplished using the second 13-period EMA and the 25-period EMA. Although it is comparable to the RSI, it is less sensitive due to double-smoothing.
Another thing that distinguishes this technical analysis indicator from others is that it can identify potential overbought and oversold levels of a stock or security.
This enables traders to identify what to purchase and sell in advance of an anticipated trend reversal, making them stay ahead of the curve.
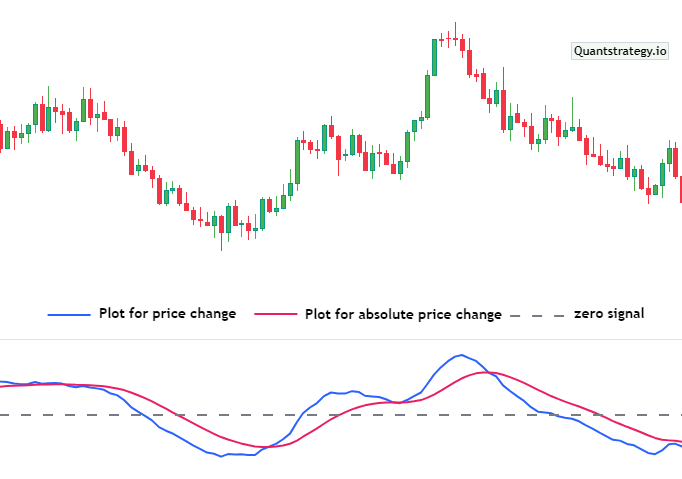
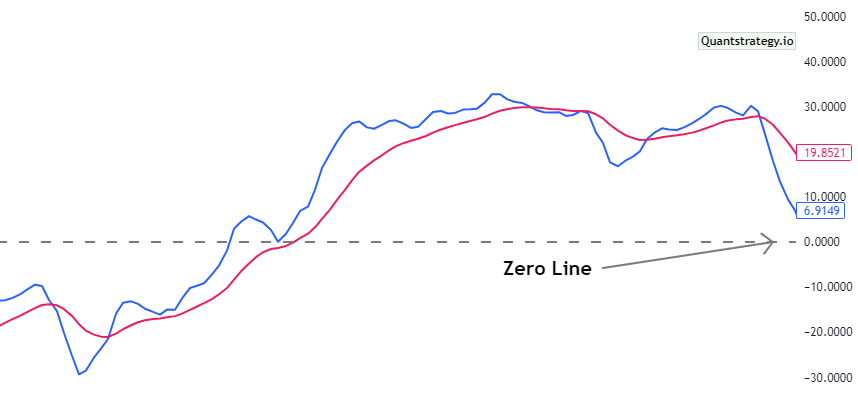
The True Strength Indicator has three lines. The zero line refers to the constant, horizontal line, and the other two are termed the plots. It’s the plots that facilitate traders to use the True Strength Index for decision-making.
The indicator is applicable to all sorts of markets, including stocks, forex, cryptocurrency, or commodities. Like most momentum oscillators, chartists may derive signals from signal line crossovers, divergences, centerline crossovers, and oversold/overbought readings.
TSI Formula
Here is the TSI formula:
True Strength Index = 100 x (Double Smoothed PC / Double Smoothed Absolute PC),
where PC is the price change – Current Close – Previous Close, and Double Smoothed is 13 period exponential moving average of 25-period exponential moving average.
You must perform the following steps to calculate the TSI.
- First, calculate the price change (PC) for 25 bars.
- Then, calculate the exponential moving average of this across 25 periods. This procedure is termed the first smoothing.
Next, calculate the exponential moving average of first smoothed values throughout the 13 periods. This procedure is called second smoothing, which means, if we use the technical terminology, that it has been double smoothed.
- After that, apply the same process to the absolute price change values.
- The True Strength Index is The double-smoothed price change divided by the double-smoothed absolute price change, multiplied by 100.
- To calculate the signal line smooth TSI values by applying a 13-period exponential moving average.
- Reading the True Strength Index
To read the True Strength Index, concentrate on the zero line present in the center. The zero line, which separates positive from negative territory, defines the range. The upper and lower range limits are denoted by +0.5 and -0.5, respectively. As of right now, the indicator line is oscillating around -0.1 in the example below, indicating bearish/negative momentum:
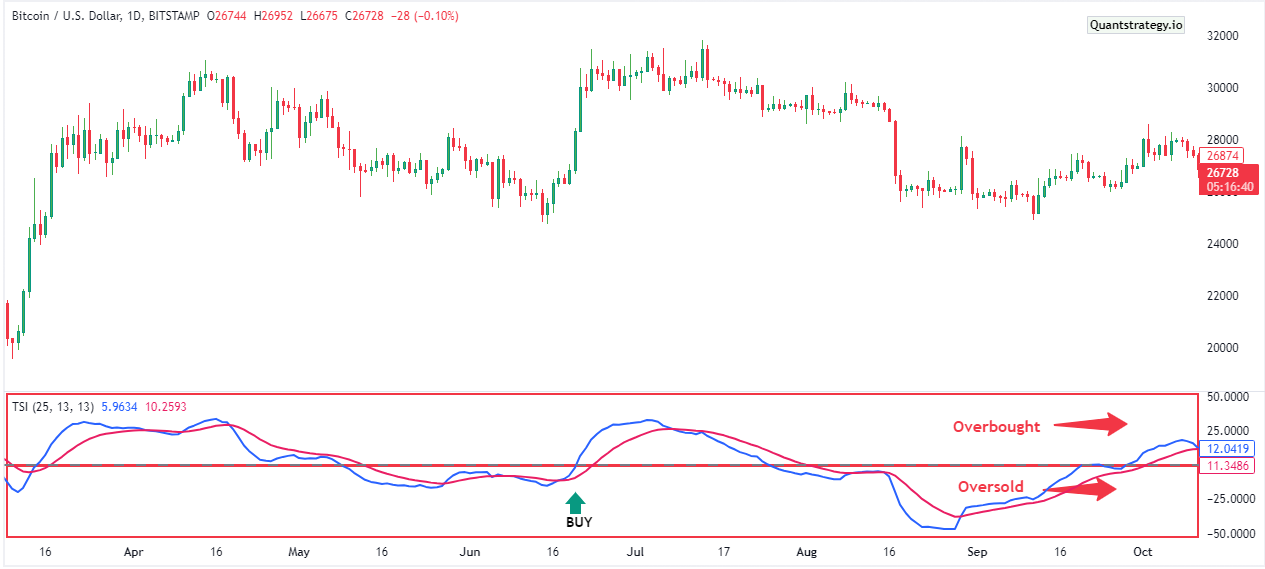
Oversold levels are indicated if the TSI line drops below the range’s lower support levels. Overbought levels are indicated if the line rises to the range’s upper resistance levels. Although Bitcoin is oversold, this does not mean it is time to buy right away. Instead, you should wait for a trend reversal before taking any action.
How to Use the True Strength Index in Trading?
Like many momentum oscillators, the True Strength Index (TSI) must only be deployed intraday when an asset’s price is trending. It isn’t ideal to use it when the price is consolidating or moving sideways. Doing this can frequently produce wrong signals.
Additionally, this technical analysis tool applies to various trading strategies, including crossovers, divergences, and trends.
Let us examine each of them.
Using True Strength Index for Trend Trading
There are two dominant trends in trend trading – bullish and bearish. A bullish trend is an uptrend in which the price rises and a bearish trend is a downtrend in which the price falls. When a bullish trend begins, a trader might go long by purchasing or short by selling when a bearish trend begins:
The True Strength Index swings back and forth across a zero line. It is bearish if True Strength Index crosses below the zero line and bullish if it crosses above the zero line. It can be seen on the 1H (hourly) chart that the trend reversed once the TSI reached lower oversold levels, and the price of bitcoin increased from 44,000$ to 47,000$.
Using True Strength Index for Swing Trading
When using the TSI for swing trading, one must buy when the value reaches the lower support levels (oversold) or sell when it reaches the upper resistance levels (overbought). Before initiating the trade, make sure the security price has reversed. If buying at lower levels, one must wait for the indicator to reverse course and begin ascending first.
Use True Strength Index and Signal Lines Crossovers for Generating Trading Signals
We learned earlier that TSI has three EMAs. A long trade can be opened if the 25-period EMA, represented by the blue line, crosses above the 13-period EMA, represented by the red line. The opposite can happen in the case of a short trade.
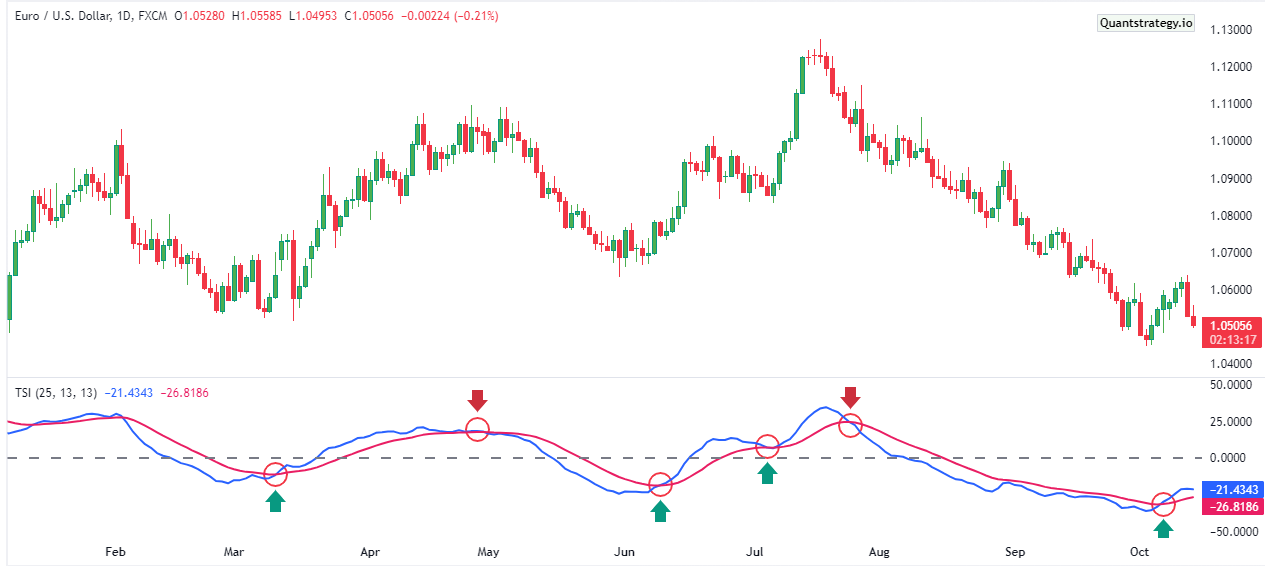
Once the two lines intersect, placing buy and sell trades is a profitable crossover technique. We can see that Bitcoin dropped from 44,000$ to 36,000$ when the red line crossed the blue line. The trend turned around when the blue line moved over the red line, and Bitcoin increased from 37,000$ to 46,000$.
Using True Strength Index for Divergence Trading
Traders use the True Strength Index for indicating divergences between asset prices and indicator. If an asset’s price moves higher while the indicator is dropping, that is known as bearish divergence and might lead to a downside price trend. On the contrary, if the price is decreasing while the indicator is increasing, that might indicate potential higher prices. This is known as bullish divergence.
Divergence should only be utilized in conjunction with other indications produced by the TSI or other technical indicators because it is a weak timing signal.
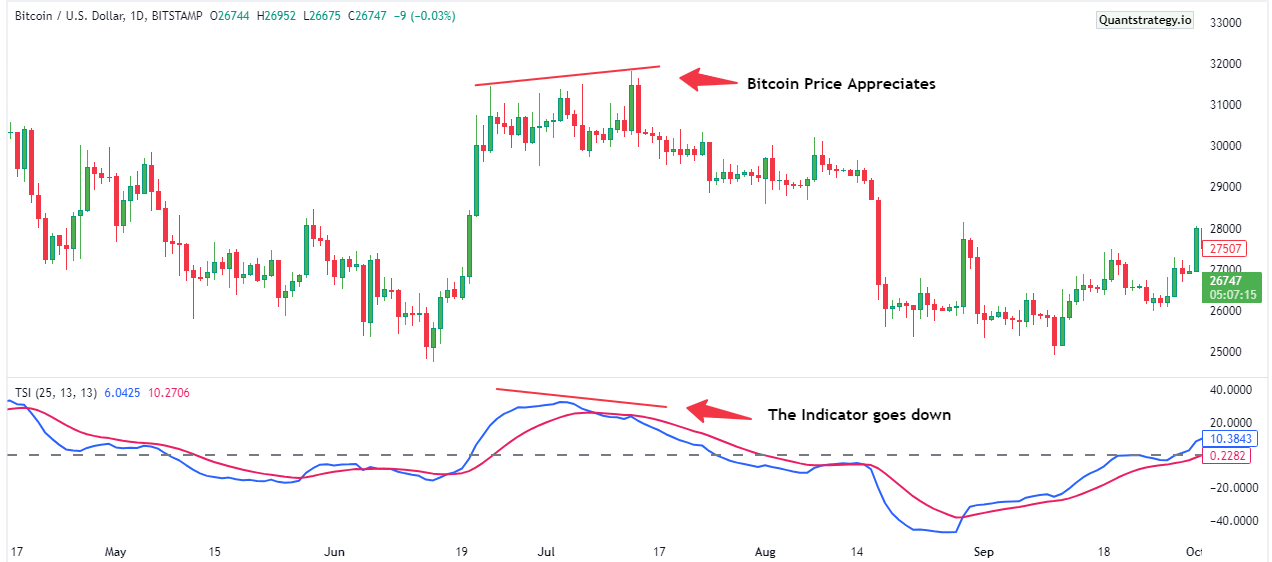
The price in the above price chart increased to 69,000$ while the TSI indicator decreased. This was later followed by depreciation over the subsequent few months.
Conclusion
True Strength Index (TSI) is an effective momentum oscillator that helps traders determine trend direction, strength, and momentum. Double smoothing decreases the number of signals, and two Exponential Moving Averages reduce the added noise or disturbance, producing an oscillator effect, which can better track price sensitivity.
Additionally, you can draw trend lines, resistance lines, and support lines on the indicator that helps fundamental investors and day traders make profitable trades.


