


Every trader should possess the essential skills of being well-versed and informed about technical indicators, as well as how to apply and interpret them. These technical indicators offer a clear indication of potential price action.
There are hundreds of indicators available at present for any type of trading strategy. The Vortex Indicator is one of the newest, perhaps most popular indicators. It serves useful in terms of discovering market trends.
We’ll cover all about the Vortex Indicator in this article, including how to use it in trading strategies.
What is Vortex Indicator (VI)?
The Vortex Indicator is a relatively new trend indicator that is used to evaluate the situation in the market. Its primary function is to identify the beginning of new trends and confirm current trends, their strength, and their direction.
There are numerous trend indicators, each with a unique set of underlying formulas and moving averages. This technical analysis indicator is special since it was created using a water flow model. An oceanic vortex is the source of the name “Vortex”. The creators used regular motions in an oceanic vortex’s wavelengths to create an indicator formula that is simple to understand.
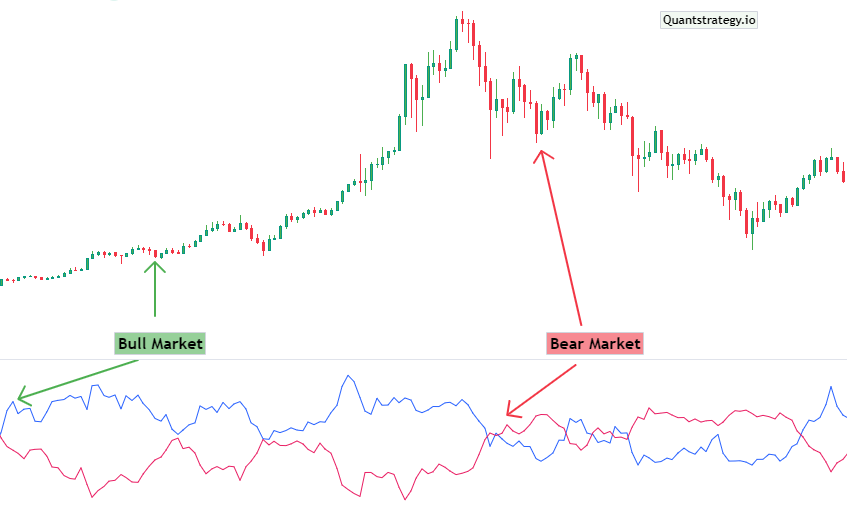
The Vortex indicator is an oscillating indicator that emerges in a box below the price chart. The Vortex Indicator is composed of two lines, which signal positive and negative trend movements – ‘VI+’ denotes the positive trend movement, and ‘VI-‘denote the negative trend movement.
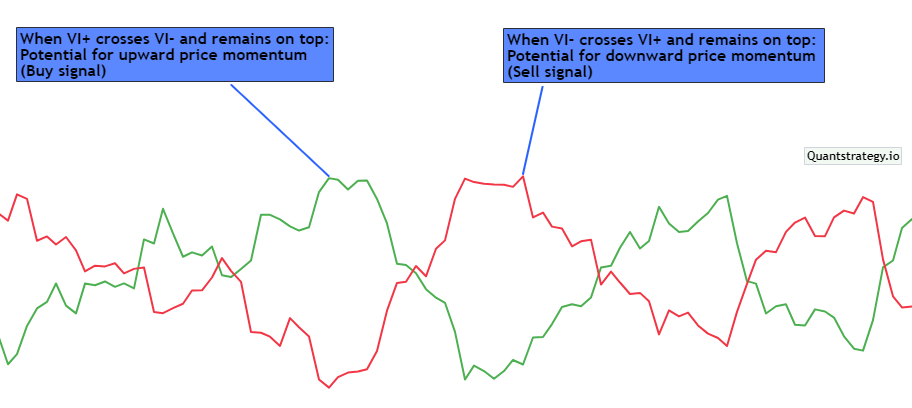
Both these lines have separate formulas and indicate bullish and bearish motions. The essence of trading with a Vortex pattern lies in using a crossover strategy, which means waiting for the two lines to cross and intersect.
A buy signal is indicated that warrants a long order when the VI+ line goes above the VI- line during a crossover and vice versa.
The Vortex Indicator can be applied to all assets and on all timeframes by novice and experienced traders.
Who invented the Vortex Indicator?
The Vortex Indicator (VI) was developed by Etienne Botes and Douglas Siepman, based on the work of an Austrian researcher, Viktor Schauberger. He is popular as the father of implosion technology, who spent decades researching the flow of water in oceans and rivers.
Etienne Botes and Douglas Siepman were inspired by the idea that flows and movements within financial markets resemble the vortex motions observed in the flow of water.
The Vortex Indicator (VI) was also partly inspired by J. Welles Wilder’s concept of directional movement, which considers the relationship between price bars and gives hints regarding the direction of a market.
The Vortex Indicator was introduced in the ‘Technical Analysis of Stocks and Commodities’ in 2010. Since then, this technical indicator has gained immense traction as a reliable trend-following indicator, which can generate surprisingly precise buy and sell signals.
How is Vortex Indicator Calculated?
The calculation of the Vortex Indicator can be split into four sections.
- Calculate the True Range (TR)
The True Range (TR) is the greatest of either of the following:
- Absolute(Current high minus the current low)
- Absolute(Current high minus the previous close)
- Absolute(Current low minus the previous close)
- Calculate the Current Uptrend Movement (VM+) and Downtrend Movement (VM-)
- VM+ is the absolute value that is calculated as the current high minus the prior low.
- VM- is the absolute value of the current low minus the prior high.
- Choose the Parameter length (n)
This is generally between 14 and 30 days. You add up the whole true range of the period, VM+, and VM-.
Calculate the sum of the true range over n periods to obtain TRn, the sum of VM+ over n periods to obtain VM+n, and the sum of the VM- over n periods to obtain VM-n.
- Calculate VI+ and VI-
You divide VM+n by TRn to get VI+ and VM-n by TRn to get VI- for the last component of the vortex indicator calculation.
It appears difficult, but once you understand it, it’s quite simple.
How to use Vortex Indicator in Trading Strategies
The Vortex Indicator alerts trading professionals when a new trend is going to start, making it useful for crossover trading. The VI crossover strategy sends a buy and sells signal when the VI+ intersects with the VI-.
The downtrend line is purple, and the uptrend line is blue by default. Typically, the top line denotes the dominant trend, whether it be an uptrend or a downtrend.
It’s important to carefully observe the intersection points of the two lines and where they stand about the overbought and oversold levels.
A ‘buy’ signal occurs when the VI+ line lies below the VI- line crosses over it, and remains on top (bullish crossover). A ‘sell’ signal occurs when the VI- line lies below the VI+ line, crosses over VI+, and remains on top (bearish crossover).
It’s important to remember that not every signal you receive should result in an open position right away. Instead, it is a signal for you to monitor the market carefully, evaluate the performance of the current asset, and think about starting a trade in the appropriate direction.
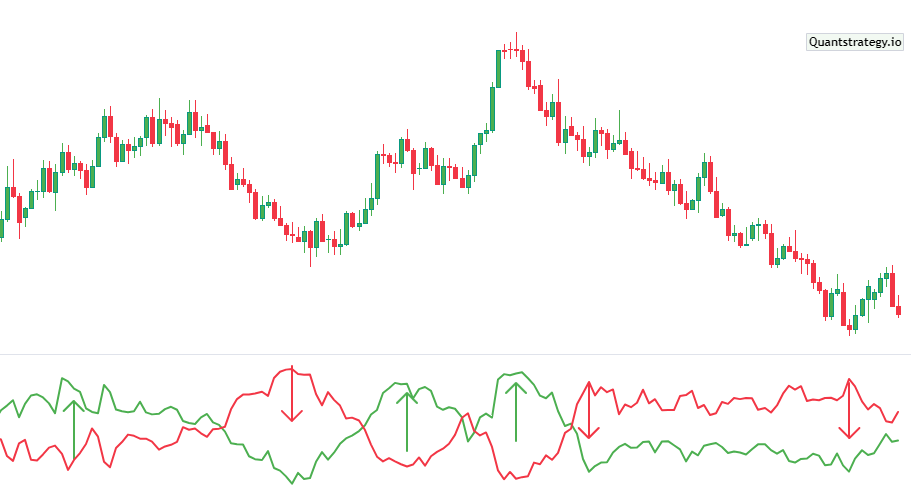
You can see the EUR/USD chart with the Vortex indicator applied in the image above. In this particular situation, crossovers indicate a change in trend direction. The trend strength is shown by the space between the lines.
False trade signals can be prevented by using other indicators along with Vortex Indicators. Either MACD or ADX will do.
Avoid mixing two indicators of the same type when creating a trading system because their signals may come from the same source, lowering their predictive potential. Trend-following indicators can work well for Vortex Indicators.
Using stop-loss and take-profit levels can also aid traders using Vortex to better control risks because no trading technique, no matter how effective, can consistently deliver precise signals.
Conclusion
The Vortex Indicator isn’t completely original because it is based on previous work performed by J. Welles Wilder. However, in reality, it is a trend-following indicator composed of two oscillating lines, which follow the market’s price bars to locate important trend change points.
This directional indicator, which provides indications and identifies trend reversals, can be used to benefit most trading techniques. It can be applied to various assets and periods.
It’s intriguing because it can be used to identify a larger trend in weekly charts and then applied to a daily chart to identify more specifics about the trend.
Analysts should concentrate on a bullish signal if the vortex indicator indicates an uptrend when working with a daily chart. It can be used for bearish signs as well.
When using the indicator, it is wise to pair it with other indicators, such as the MACD, to reduce false signals.


