Have you ever wondered how the “smart money” quietly accumulates assets before a major rally or distributes them before a crash? The Wyckoff Method, a timeless trading strategy developed by Richard D. Wyckoff in the 1930s, provides the blueprint.
This powerful Wyckoff Theory is built on analyzing supply and demand to identify the recurring Wyckoff cycle of Wyckoff accumulation and Wyckoff distribution.
In this article, we will demystify the core principles of the Wyckoff trading approach.
You will learn how to spot these phases on a chart, interpret market structure, and ultimately, make more informed and confident trading decisions.
Understanding the Wyckoff Theory
The Wyckoff Theory (Wyckoff Method) revolves around the idea that the market can be analyzed and predicted by studying the relationship between supply and demand. According to Wyckoff, market trends are driven by the activities of large institutional players, known as “smart money.“
By closely observing the actions of these smart money investors, traders can gain valuable insights into the future direction of the market.
The Three Laws of Wyckoff Model
Law of Supply and Demand:
The first law of the Wyckoff analytics is based on the fundamental principles of supply and demand. It states that the price of a financial instrument is determined by the balance between the supply of sellers and the demand of buyers.
When demand exceeds supply, prices tend to rise, and when supply exceeds demand, prices tend to fall. Traders using the Wyckoff method analyze the relationship between supply and demand to anticipate future price movements.
Law of Cause and Effect:
The second law of the Wyckoff Method emphasizes the concept of cause and effect in the financial markets. It suggests that every significant price movement is a result of an underlying cause or accumulation/distribution phase.
During the accumulation phase, smart money investors accumulate positions, creating a cause. The subsequent effect is a markup phase where prices rise. Similarly, during the distribution phase, smart money investors distribute their positions, creating a cause for a subsequent markdown phase where prices decline.
Traders who understand and identify Wyckoff logic cause-and-effect relationships can make more accurate predictions about future price movements.
Law of Effort vs Result:
The Third law of the Wyckoff method focuses on the relationship between the effort exerted by buyers and sellers and the resulting price movement. It suggests that price changes should be accompanied by an increase in volume or effort.
In other words, significant price movements should be supported by higher trading volumes, indicating the presence of substantial buying or selling pressure. Traders using the Wyckoff method analyze volume patterns and the effort exerted by market participants to validate price movements and identify potential turning points.
By understanding and applying these Wycoff three laws, traders can gain valuable insights into the dynamics of the market, identify potential buying and selling opportunities, and improve their overall trading strategy.
The Four Stages of the Wyckoff Method
According to Wyckoff’s logic, a price trend never repeats itself exactly and trends must be studied in context with past behavior.
The Wyckoff Theory outlines four distinct stages that occur in the market:
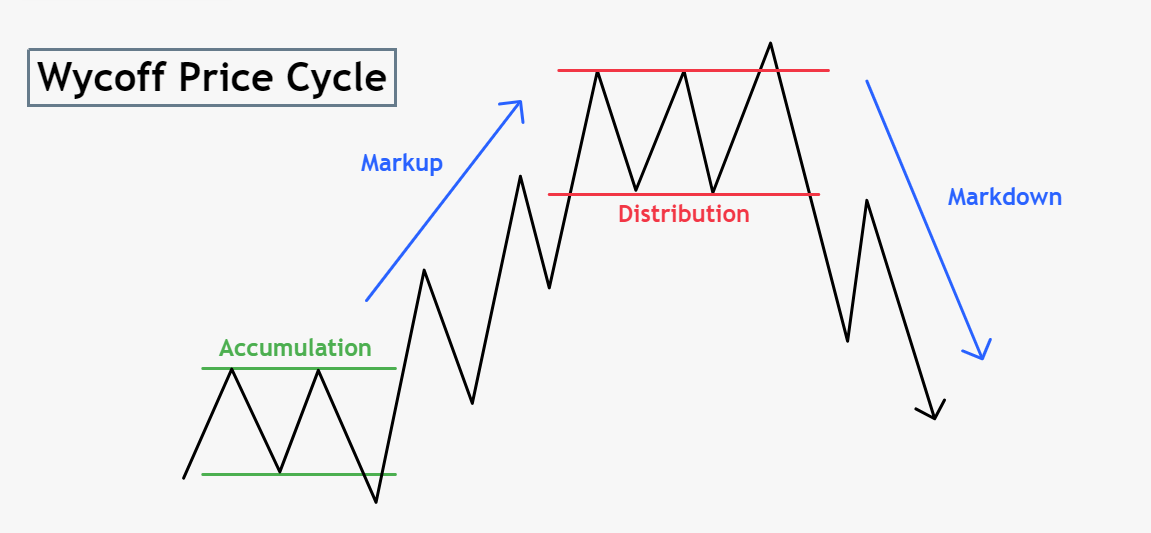
Wyckoff Accumulation
During the Wyckoff accumulation phase, smart money investors strategically accumulate positions in a particular asset. Prices in this stage often trade in a range or show a gradual uptrend.
Wyckoff accumulation phase can be likened to a spring being compressed, as the asset’s value is accumulated before a potential markup phase.
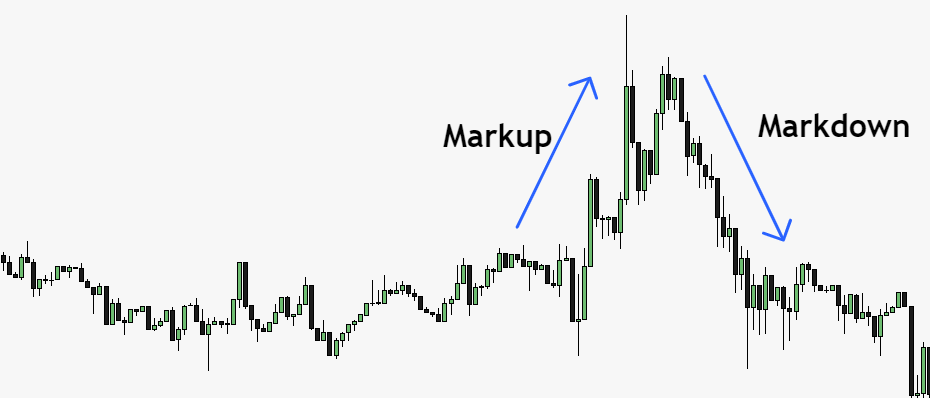
Markup Phase
Once the Wyckoff accumulation is complete, the markup phase begins. This stage is characterized by a significant price increase as smart money investors release their accumulated positions to the broader market.
It is during this phase that traders look for potential buying opportunities to ride the upward trend.
Wyckoff Distribution
After the markup phase, the Wyckoff Distribution phase ensues. During Wyckoff Distribution stage, smart money investors start selling their positions to retail traders and other market participants.
Prices often trade in a range or show a gradual downtrend. Traders need to be cautious during this phase as it may indicate an impending downtrend.
Markdown Phase
The markdown phase marks the final stage of the Wyckoff Method. Prices experience a significant decline as supply overwhelms demand.
This phase can be compared to a stretched spring being released, as the asset’s value plummets. Traders need to be cautious during this stage and avoid taking long positions.
In the Wyckoff Theory, the term “composite man” refers to the collective actions and manipulations of smart money investors or large institutional players in the financial markets. The composite man is an imaginary figure created by Richard D. Wyckoff to represent these influential market participants who have a significant impact on price movements.
According to the Wyckoff analytics, the composite man is responsible for the four stages of the market: accumulation, markup, distribution, and markdown. The composite man strategically accumulates or distributes positions over time, creating Wyckoff pattern and trends that can be observed and analyzed by traders.
The actions of the composite man are believed to be driven by their knowledge, experience, and access to resources, allowing them to make informed decisions and anticipate future market movements. By closely studying the actions of the composite man, traders using the Wyckoff Theory aim to gain insights into the intentions and direction of the market.
Applying the Wyckoff Method to Your Trading Strategy
Now that we have a basic understanding of the Wyckoff Theory and its stages, let’s explore how you can utilize this knowledge to enhance your trading strategy:
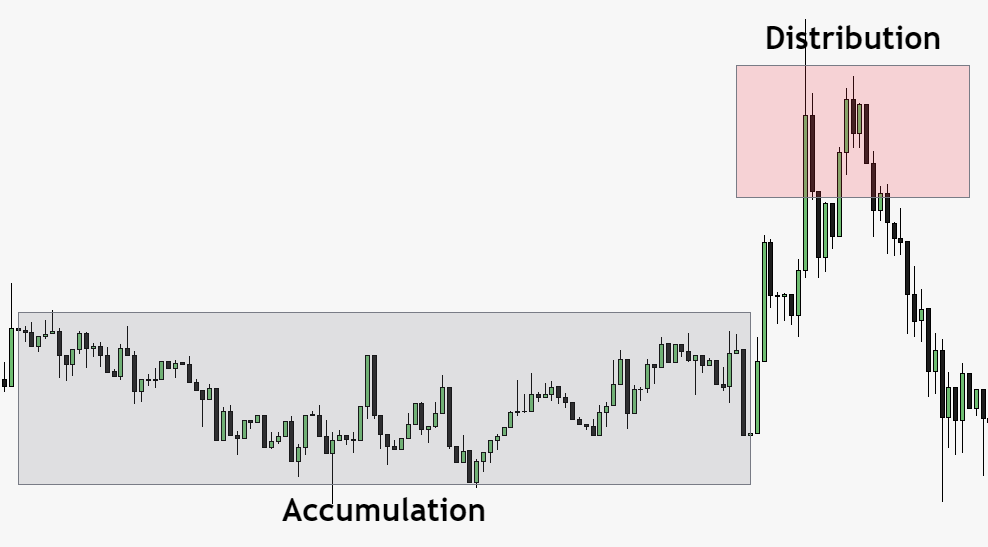
1. Recognizing Wyckoff Accumulation and Distribution Phases
By studying price charts and volume patterns, you can identify potential accumulation and distribution phases. Look for periods of consolidation or range-bound trading, accompanied by decreasing volume.
These can be indications of smart money investors accumulating or distributing their positions.
2. Confirming Markup and Markdown Phases
Once you identify potential Wyckoff accumulation or distribution phases, it’s crucial to confirm the subsequent markup or markdown phases.
Look for increased buying or selling pressure, accompanied by higher volumes and strong price movements. These confirmatory signals can help you time your trades more effectively.
3. Implementing Stop Loss and Take Profit Levels
To manage risk and protect your capital, it’s essential to implement appropriate stop loss and take profit levels. Place your stop loss orders below significant support levels during accumulation phases or above key resistance levels during distribution phases.
Similarly, set your take profit orders conservatively to secure profits during markup phases or markdown phases.
4. Utilizing Additional Technical Indicators
While the Wyckoff Theory provides valuable insights into market trends, it can be further enhanced by incorporating additional technical indicators. Consider using tools like moving averages, oscillators, or trend lines to validate your Wyckoff-based analysis and strengthen your trading decisions.
Wyckoff Accumulation:

Wyckoff Accumulation is a phase in the Wyckoff Methodology that signifies a period of institutional buying and accumulation of a particular asset or security. This phase is characterized by a gradual accumulation of shares by smart money investors, often referred to as the “Composite Operator” or “smart money traders.”
During the accumulation phase, the price of the asset tends to trade in a relatively tight range or a sideways pattern. This sideways movement occurs as the Composite Operator absorbs selling pressure from weak holders, accumulating shares at favorable prices. The primary objective of accumulation is to establish a substantial position in the asset before the markup phase begins.
Key Characteristics and Principles
There are several key characteristics and principles associated with Wyckoff Accumulation:
- Trading Range: Accumulation typically occurs within a defined trading range, where the price oscillates between support and resistance levels. This range-bound price action indicates a balance between buying and selling pressure.
- Volume Analysis: Volume analysis is crucial in Wyckoff Accumulation. Initially, trading volume is relatively high as the Composite Operator absorbs selling pressure. As the accumulation progresses, volume tends to diminish, reflecting decreased selling interest and the presence of strong hands.
- Effort vs. Result: Wyckoff emphasized analyzing the relationship between effort (volume) and result (price movement). In accumulation, diminishing effort (volume) during price reactions indicates a decrease in selling pressure and an increased likelihood of an upward breakout.
- Absorption of Supply: The accumulation phase involves the absorption of selling by the Composite Operator. This absorption occurs as the Composite Operator strategically accumulates shares, often at lower prices, from weak and unsuspecting market participants.
- Sign of Strength (SOS): A Sign of Strength is a technical pattern that occurs within the accumulation phase. It represents a notable increase in buying interest, often accompanied by higher volume and a breakout above a key resistance level. SOS indicates that the Composite Operator is confident in the potential future markup phase.
- Last Point of Support (LPS): The Last Point of Support is the final test of the trading range’s lower boundary, which confirms the absorption of selling and provides an opportunity for the Composite Operator to accumulate shares at favorable prices.
Traders and investors who recognize the accumulation phase can position themselves for potential future price appreciation during the markup phase. Understanding the characteristics and principles of the Wyckoff Accumulation allows market participants to identify potential entry points and trade in harmony with the actions of the smart money operators.
It is important to note that while Wyckoff Accumulation can provide valuable insights, it is not a foolproof indicator of future price movements. Traders should always employ proper risk management techniques, conduct a thorough analysis, and consider additional factors before making trading decisions based on Wyckoff accumulation patterns.
What is Wyckoff Distribution Cycle?
An accumulation cycle is typically followed by what is known as Wyckoff Distribution.

Wyckoff Distribution Schematic
After the dominant traders have increased their position during the Wyckoff Accumulation cycle, they will sell off their positions when the asset’s price is high. Traders see this as supply and demand patterns. The Wyckoff Distribution cycle will happen across five phases.
1. Preliminary Supply (PSY)
This phase typically occurs after a prominent price rise. Dominant traders will sell off large portions of their positions increasing the trading volume.
2. Buying Climax (BC)
The increased supply causes retail traders to begin taking up positions. This demand causes the price to continue rising. Dominant traders can sell off their positions at a premium price. However, this phase relies on high demand from retail traders so that the selling off by dominant traders does not bring down the asset’s price.
3. Automatic Reaction (AR)
The end of the BC phase is marked by a price drop. This happens as fewer traders are buying up positions even though there is still a large supply available. The increased number of sell orders or supply causes the price to drop. It will eventually reach the AR level which is the lower price boundary of the Wyckoff Distribution Cycle.
4. Secondary Test (ST)
In this phase, the price rises back to the BC range. This is where traders are testing the balance of supply and demand. The top price of this test occurs when there is more supply than demand. As the price reaches the BC price range, less trading will occur.
5. Sign of Weakness, Last Point of Supply, Upthrust After Distribution (SOW, LPSY, UTAD)
The SOW occurs when the asset’s price falls near or below the initial boundaries of the respective Wyckoff Distribution Cycle. This occurs when there is more supply than demand and signals price weakness.
Following the SOW is the LPSY. In this phase, traders are testing the support of the asset’s price at these lower levels. There may be a small rally, but any rallies will be difficult as the result of either too much supply or too little demand.
The last possible phase is the UTAD, which is just what it sounds like. This phase of the Wyckoff Distribution Cycle is not guaranteed to occur, but if it does, it will typically occur near the end of the overall cycle. The asset’s price will increase as a result of increased demand and push the upper price boundary of the entire cycle.
Does the Wyckoff method work?
The Wyckoff Method has been widely used and followed by traders for decades, and many practitioners believe that it can be an effective approach to analyzing markets and making trading decisions.
However, it is important to note that no trading method or strategy is guaranteed to work perfectly in all market conditions. The success of the Wyckoff Method, like any trading approach, depends on various factors such as the trader’s skill, experience, ability to interpret market dynamics, and adherence to proper risk management practices.
The Wyckoff Method is based on the principles of Supply & Demand, price-volume analysis, and understanding the intentions of institutional traders. It provides a comprehensive framework for studying market behavior, identifying the accumulation and distribution phase, and anticipating potential trend reversals. By analyzing price patterns, volume spikes, and market sentiment indicators, traders aim to make informed decisions about when to enter or exit trades.
One of the key advantages of the Wyckoff Method is its focus on understanding the actions of the “Composite Operator,” who represents institutional traders. By studying their accumulation and distribution patterns, traders attempt to align their positions with the prevailing market trend and the intentions of these professional traders. This approach can potentially provide valuable insights into market dynamics and increase the probability of successful trades.
However, it is important to recognize that trading involves inherent risks, and no methodology can guarantee profits or eliminate the possibility of losses. Market conditions can change rapidly, and unexpected events can impact price movements. Traders using the Wyckoff Method, like any other approach, need to continuously adapt, apply proper risk management techniques, and employ additional analysis tools to make well-informed trading decisions.
Ultimately, the effectiveness of the Wyckoff Method will vary among individual traders. Some traders may find success and resonate with the principles and techniques of the Wyckoff Method, while others may prefer different approaches. It is essential for traders to thoroughly study and understand the methodology, practice in real market conditions, and continuously learn and refine their skills to maximize their potential for success.
Who is Richard Wyckoff?

Richard Wyckoff was a very successful American stock market investor in the early 1900s. He was considered one of the titans of technical analysis of the stock market.
After accumulating his great wealth, Wyckoff began to see what he considered the swindling of the retail trader by big corporations in the market. As a result, he decided to organize his trading methods and teach them to the general public.
His teachings were distributed through many channels, including his own Magazine of Wall Street periodical and his work as an editor of Stock Market Technique.
Conclusion
The Wyckoff Theory is a powerful tool that can significantly improve your trading strategy by providing valuable insights into market trends and price action.
By understanding the four stages of accumulation, markup, distribution, and markdown, and applying this knowledge to your analysis, you can make more informed trading decisions and increase your chances of success.
Remember to combine the Wyckoff Method Theory with other technical indicators and risk management strategies to create a well-rounded approach to trading.
Key Takeaways
Understanding the phases of the Wyckoff market cycle (accumulation, markup, distribution, and markdown) provides valuable insights into market dynamics and potential trading opportunities.
Market sentiment analysis and Intermarket analysis are important aspects of the Wyckoff Method. By assessing market sentiment indicators and studying the relationships between different asset classes, traders can gain insights into broader market trends.
Developing a well-defined trading plan tailored to your goals, risk tolerance, and trading style is essential. A trading plan should include entry and exit criteria, risk management strategies, and trade monitoring techniques.
Continuous learning, practice, and observation are vital for mastering the Wyckoff Method. Engage with online communities, study real-life case studies, and learn from experienced Wyckoff traders to further enhance your understanding and skills.
Indicators Backtest Library
At QuantStrategy, we believe in validation through data.
That’s why we’ve built a library of backtests on foundational tools like the industry standard indicators.
Curious about the specific win rate, maximum drawdown, and overall performance of strategies on the 6000+ stocks?
We’ve done the heavy lifting.
Click here to explore the full backtest report and turn your market curiosity into a strategic edge.
FAQ
Q: What is Wyckoff logic in trading?
A: Wyckoff logic is the core reasoning framework behind the Wyckoff Method, designed to understand the market’s underlying supply and demand dynamics.
It’s not just a set of rules, but a way of thinking about why price moves. The fundamental logic is built on the concept of “Composite Man,” viewing all market action as the result of a large, coordinated entity’s efforts to accumulate and distribute assets at favorable prices.
This logic helps traders answer critical questions: Is a price rise due to genuine demand (strength) or a short squeeze? Is a decline caused by distribution (weakness) or a stop-loss run?
By applying Wyckoff logic—analyzing price, volume, and time—traders can anticipate the market’s next probable move instead of just reacting to it.
Q: How do I use Wyckoff analytics?
A: Using Wyckoff analytics involves a structured, step-by-step process to identify high-probability trading opportunities. Think of it as conducting detective work on the chart.
Here is a practical approach:
- 1. Determine the Overall Trend: Use the Wyckoff “Phases” (Accumulation, Markup, Distribution, Markdown) to identify where the asset is in its cycle. This is your macro view.
- 2. Analyze Price and Volume Relationship: This is the heart of Wyckoff analytics. Look for specific signals:
- Effort vs. Result: Is high volume (effort) leading to a significant price move (result)? If not, it suggests a potential reversal. For example, high volume on a rally that fails to make a new high is a sign of weakness.
- Climactic Action: Identify selling climaxes (at bottoms) and buying climaxes (at tops), which often mark the end of a phase.
- 3. Apply the Wyckoff Laws: Use the three core laws to guide your analysis:
- Law of Supply and Demand: Directly determines price direction.
- Law of Effort vs. Result: Provides early warning of a trend change.
- Law of Cause and Effect: Helps project the potential price target from a trading range (the “cause”).
- 4. Identify Specific Entry & Exit Signals: Use chart patterns like Springs, Upthrusts, and Back-ups to the edge of a trading range to time your trades.
By systematically applying these Wyckoff analytics, you move from subjective guessing to an objective, rules-based analysis of the markets.