


Has the abundance of advanced technical indicators ever left you feeling overwhelmed as a trader? You aren’t alone. Although indicators can be useful tools, depending on just one can feel like driving with a blindfold. However, you can gain a deeper understanding of the market and improve the quality of your trading judgments by combining indicators. Two such reliable indicators used by traders are the Average Directional Movement Index (ADX) and the Moving Average.
Each of these indicators individually offers insightful information about market momentum and trends, but the multi-indicator approach can produce more robust trade signals and give you a better idea about what to expect.
This blog post focuses on how traders can combine ADX and Moving Average in a trading strategy and increase their chances of success.
Understanding Average Directional Movement Index
The ADX indicator, also called the Average Directional Index, Directional Movement Index, or DMI, is a technical indicator with the help of which traders identify the trend’s strength and direction. It was created by J. Welles Wilder, a popular trader who also introduced the Relative Strength Index (RSI), Parabolic SAR, and Average True Range (ATR). Although he designed the indicator with commodities in mind, traders may also effectively use it with stocks, currencies, and other assets.
This technical analysis tool ranges from 0 to 100 and recognizes whether a market is ranging or trending. A higher ADX value (40% and more) suggests a strong trend, whereas low ADX values (0-20%) display a weak trend or ranging market. Seldom does the indicator line cross 60%.
The Average Directional Movement Index consists of three lines. There is one main, solid ADX line and two dotted lines for the positive directional indicator (+DI) and negative directional indicator (-DI). The latter two make the foundation for the ADX. All these lines can be seen in the example below.
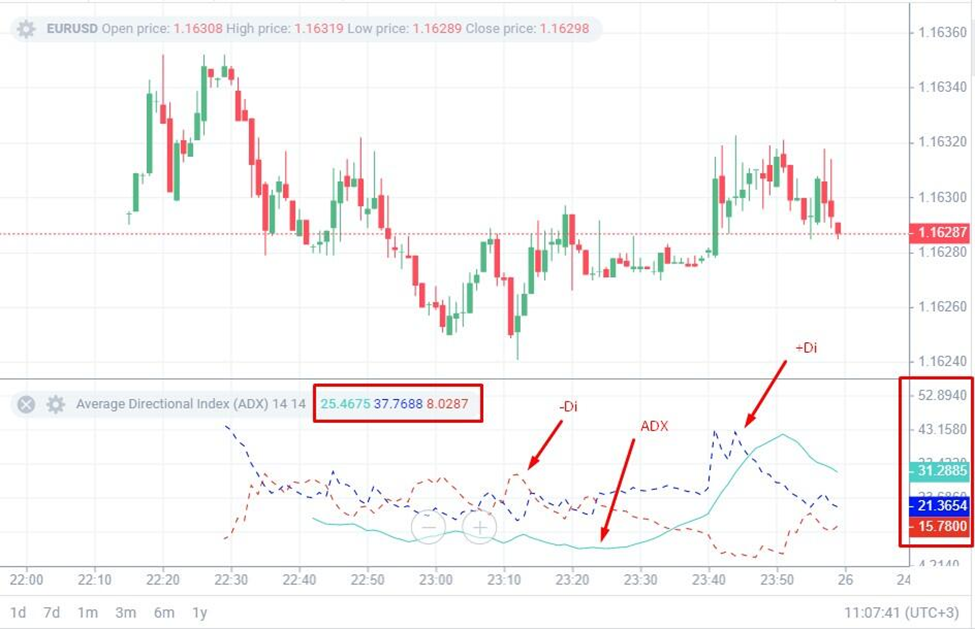
The ADX line is important for analyzing the trend strength in the market. The upper line represents the settings and current level readings of each line.
The difference between two directional indicators, the positive directional index (+DI) and the negative directional index (-DI) is used to compute the Average Directional Index. The strength of upward price movements is measured by the +DI, and the strength of downward price action is measured by the -DI.
Moreover, the ADX is a lagging indicator, so it offers information regarding past price movements. Nevertheless, it remains a useful tool for traders because it aids in verifying the existence of a trend and preventing false signals.
Like many momentum indicators, the Average Directional Movement Index is used in combination with other indicators to increase trend analysis and create trading strategies.
ADX can be computed using a method that incorporates smoothing techniques to lessen the impact of price volatility. As a result, the general market trend is represented more accurately.
Introduction to Moving Average (MA)
A Moving Average (MA) is one of the best technical analysis tools used to make trading judgments. In fact, it is so widely used that it serves as the basis for the majority of technical indicators, including the Moving Average Convergence Divergence (MACD), Bollinger Bands, Envelopes, and even the Average Directional Movement Index (ADX).
In essence, a Moving Average maps the average price of a security in a particular period and smooths out price data to form a single flowing line. It is referred to as ‘moving’ because it continuously recalculates and updates the average price as fresh data becomes available. This computation uses an average of a specific number of past prices to show the asset’s direction and momentum. It is a great tool for traders and investors to spot market trends and possible buying or selling opportunities.
Types of a Moving Average
There are several methods for calculating a Moving Average, each having advantages and disadvantages. While a certain Moving Average is slower and more dependable, others react to changes in price more quickly. One is better at spotting short-term trends, whereas the other is better at spotting long-term trends. A vast range of MAs are available for traders and analysts to select from that can best fit their trading methods and demands.
Simple Moving Average (SMA)
It is the most common and popular type of Moving Average that calculates the average price of a security by the total number of periods in that range. It gives equal weight to all periods. For example, all days are equally considered when calculating the 200-day Moving Average. This may not reflect the latest occurrences in security.
A Simple Moving Average, like other MAs, identifies the trend of the asset, trend reversal, stops, and key support and resistance levels.
Exponential Moving Average (EMA)
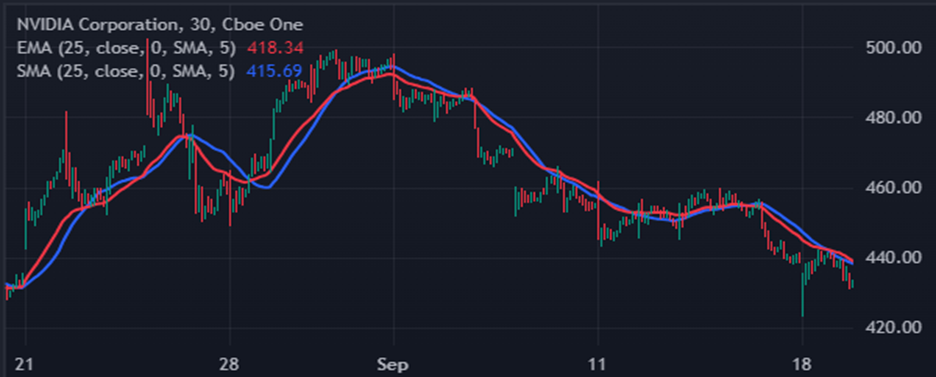
EMA eliminates the lag in SMAs by prioritizing the most recent price. As a result, in a 200-day EMA, the most current data usually takes precedence over the data that occurred 200 days ago.
This is accomplished by first figuring out the SMA and then locating a multiplier. Using the multiplier figure, you compute the EMA in the last step. As can be seen below, the blue SMA is less reactive than the red EMA.
Weighted Moving Average (WMA)
Like the EMA, the Weight Moving Average reduces the noise present in the SMA and eliminates the lag in it by deducting the weight of an asset’s “ancient” prices. It accomplishes this by giving current data greater weight as well. The price of each bar is multiplied by a weighting factor to achieve this.
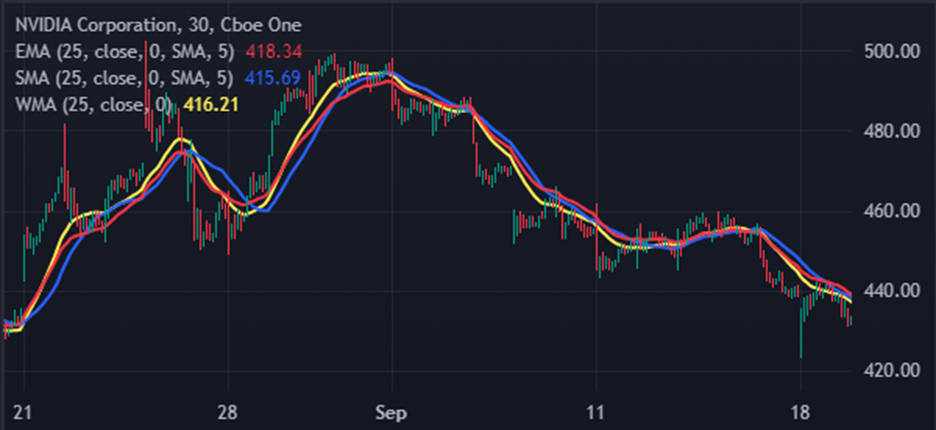
You can again see below that the WMA monitors the price more precisely than the EMA and SMA It can, therefore, send out stronger signals.
Smoothed Moving Average (SMMA)
The SMMA seeks to lessen the noise within the SMA, much like the EMA and VWMA do. It is a sort of EMA as it is applicable for a longer duration.
As a result, the current and historical data are given equal weight. It considers all accessible data series and does not refer to a specific time frame.
Volume Weighted Moving Average (VWMA)
This kind of MA takes volumes and asset values into account. Volume is a crucial component of the market because it displays the weighting. The following formula is used to calculate the VWMA: Sum of Closing price x Volume / Sum of Volume.
Other varieties of a Moving Average include:
- Arnaud Legoux MA
By computing each moving average concurrently, this MA lessens the difficulties faced by other MAs.
- Least Squares Moving Average (LSMA)
This kind of MA reduces the impact of price anomalies. The least squares regression approach is used to calculate it.
Combining ADX and Moving Average for an Effective Trading Strategy
Traders frequently employ the ADX indicator in combination with other indicators such as a Moving Average, support and resistance levels, and trendlines to verify the strength of the trend and make wise trading decisions.
In times when the ADX readings are high, traders can think about employing trend-following techniques like trailing stops or MAs to follow the trend and make the most money. Maintaining a careful eye on the market and modifying trading tactics as the trend moves forward is essential.
Here is how you can effectively combine the two indicators for improved trend analysis and trustworthy entry signals.
Identifying the Strength of the Trend
By employing the ADX indicator with Mas, traders can confirm the strength of the trend. When ADX is increasing and is above a particular threshold (generally 25 or 30), it suggests a strong uptrend. When an asset is in an uptrend, it typically stays above the moving average.
The trend direction can then be confirmed by using the Moving Average. For instance, if the Average Directional Movement Index is increasing and is above the threshold, and the price of the asset is above the 200-day SMA, it indicates a strong bullish trend.
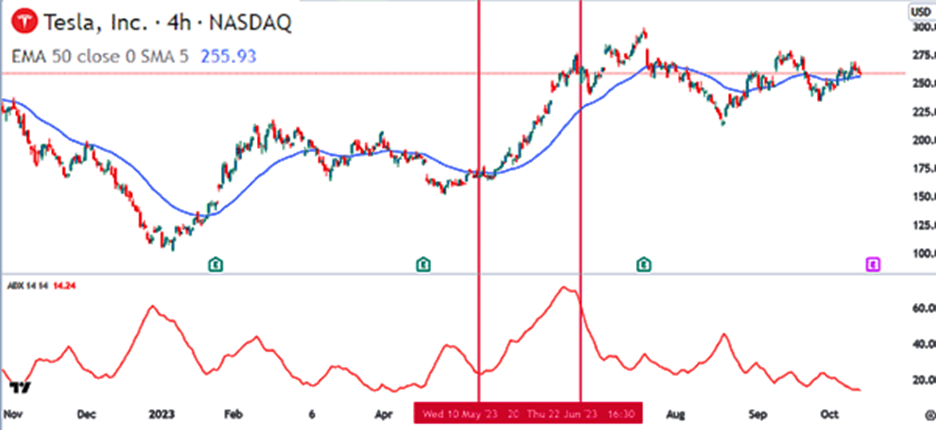
As depicted below, Tesla shares continued to move in a bullish trend as the ADX continued rising because they were above the 50-period moving average. As soon as the ADX started moving down, this trend came to an end.
Similarly, ADX can confirm the strength of the downtrend. If its value is above the threshold, and the price crosses below the 200-day SMA, it suggests a strong downtrend and confirms a bearish signal from the MA.
The following tips should be kept in mind when using ADX with MA to identify the strength of the trend:
- Use a Moving Average crossover approach in conjunction with ADX. You can improve your chances of placing good trades by combining the signals produced by the two indicators.
- Take into account the trading time frame. ADX might perform better on longer periods, such as daily or weekly charts, in which trends are typically more pronounced and consistent.
- Don’t rely on ADX alone. While it may offer insightful information, it is better to consider fundamental analysis and other indicators before making any trading choices.
- Test out various threshold values. The market and the particular asset or stock you are trading may have an impact on the threshold value for ADX that you select. Backtesting different values to determine which one suits your trading strategy the best is a smart idea.
Entry and Exit Signals
Combining ADX with MAs can offer robust entry and exit points. For example, a rising ADX and a price cross above the 50-day EMA may indicate a possible buying opportunity. On the other hand, a possible selling opportunity may be indicated if the price crosses below the 50-day EMA and the ADX is declining.
Some tips for effectively combing them for powerful entry and exit signals are:
- Using multiple time frames is crucial for verifying signals. For instance, if you note a bullish entry indication on the daily chart, consider checking the higher time frames (weekly or monthly) to make sure the trend is in line.
- Consider employing various types of MAs (SMA, EMA) to hone your indications further.
- A higher chance of profitable trades can be achieved by combining the ADX and MAs with additional indicators or patterns.
- Review and modify your trading strategy in response to market developments and the effectiveness of your signals.
Preventing False Signals
One of the difficulties faced by traders is determining the difference between short-term fluctuations and true trend reversals. Traders can eliminate false signals and concentrate on high-probability trading opportunities by combining ADX with MAs. If the price goes below the 50-day SMA, for instance, and ADX is low, but it stays flat or rises soon after, it could indicate that the trend is not reversing.
Conclusion
Combining the ADX indicator and MAs can be an effective trading strategy for traders and investors aiming to increase success and profitability. They can make informed trading decisions and obtain a deeper understanding of the market by using together the abilities of ADX to determine the strength of a trend and Moving Average to confirm the direction of the trend and spot entry and exit positions. But like with any trading strategy, it is crucial to backtest and adjust the method to fit each trader’s risk tolerance and trading style. Combining ADX with Moving Averages can provide traders with a competitive edge in the financial markets if they practice responsible risk management and discipline.


