


Traders use a variety of technical indicators in Forex trading to identify trends, determine market sentiment, and make wise trading decisions. Two of the most popular technical tools available in this domain that stand out for their trading capabilities are Ichimoku Cloud and Bollinger Bands.
While each has its own strengths, many traders combine Bollinger Bands with Ichimoku Cloud to increase the reliability of trading signals and strengthen their trade confirmations. Traders can minimize false signals and improve the quality of their trading selections by utilizing the advantages of multiple indicators.
This guide discusses the fundamentals of Ichimoku Cloud and Bolling Bands individually and then explains how to combine them effectively to form a strong trading strategy.
Ichimoku Cloud – Explained
Ichimoku Cloud indicator, also called Ichimoku Kinko Hyo, is a comprehensive trend-following indicator used to study financial markets. It was developed in the late 1930s by Goichi Hosoda, a journalist from Japan. It has grown in popularity in recent few years due to its ability to offer multiple forms of analysis in a single chart as well as easing the job of a trader to find areas of trend direction, importance, and the potency of the price movement.
As to the Ichimoku history, Ichimoku Kinko Hyo is an Asian term referring to Japanese. The words for “chart,” “equilibrium,” and “a glance” are translated as Ichimoku, Kinko, and Hyo, respectively. Altogether it means “a glance at a chart in equilibrium”
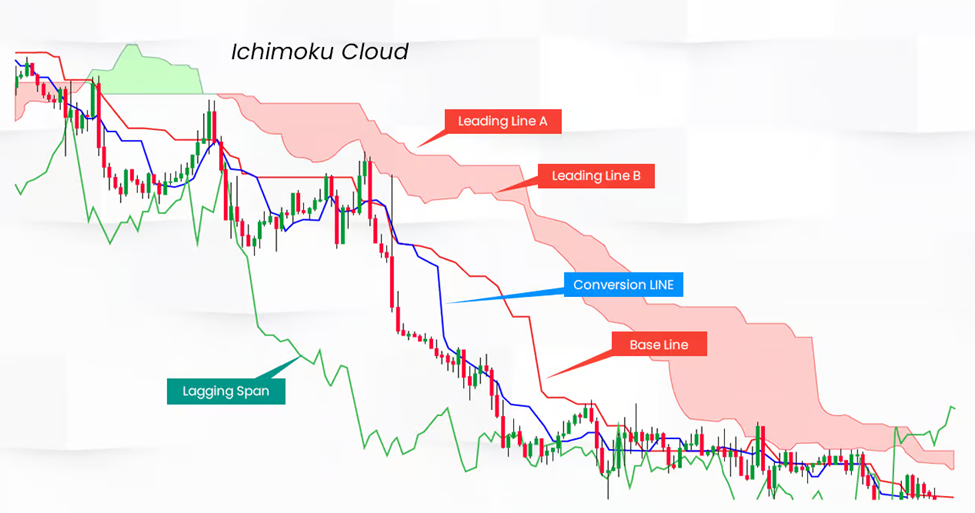
The Ichimoku indicator is a powerful technical analysis tool that combines momentum strategy and trend analysis to make profitable trades. It consists of five lines that are plotted on a chart to offer a detailed view of trend direction, momentum, support, and resistance. These lines are:
- Tenkan-sen (Conversion Line): The Conversion line marks the midway point of the previous 9 candles or periods. It is the average of the highest high and the lowest low of the previous nine periods. This line offers a short-term perspective on price movement and helps traders identify potential trend reversals in the market.
- Kijun-sen (Base Line): The Base line is similar to Tenkan-sen but is computed over a longer time (generally 26 periods). Hence, it is the average of the highest high and the lowest low of the past 26 periods. It offers a medium-term perspective on price movements and acts as a support or resistance level on a chart.
- Senkou Span A (Leading Span A): The Leading Span A is the average of Tenkan-sen and Kijun-sen lines and is plotted 26 periods forward. This line behaves as the first edge of the cloud and is a prospective indicator that represents the future support or resistance levels.
- Senkou Span B (Leading Span B): The Leading Span B is calculated as the average of the highest high and the lowest low of the past 52 periods. It is plotted 26 periods forward and forms the second boundary of the cloud. It offers additional support/resistance levels.
- Chikou Span Line (Lagging Span): The Lagging Span line is the current closing price plotted 26 periods backward on the price chart. It demonstrates the lagging trend and confirmation and provides a visual depiction of the historical price data on the price chart. When the Chikou Span line is above the current price, it indicates a bullish sentiment; when it is below, it indicates a bearish sentiment.
The region between Senkou Span A and Senkou Span B demonstrates the cloud (Kumo) that indicates possible support and resistance levels. Its thickness signals the volatility of the asset, and its color (generally red for bearish and green for bullish) demonstrates the prevailing trend.
The Ichimoku system is a versatile technical tool that can be employed on any financial instrument and time frame to identify trend direction and momentum as well as provide clear signals for potential entry and exit points.
Traders can improve the quality of their trading decisions and risk management by combining these signals with other indicators.
Understanding Bollinger Bands
Bollinger Bands are among the most admired technical analysis tools. They were developed by a renowned technical analyst named John Bollinger in the 1980s for trading stocks. The bands make up a volatility indicator that calculates the relatively high or low price of security concerning previous trades.
Bollinger Bands uses a moving average (SMA or EMA) and two standard deviation-based bands (which fluctuate as volatility rises or falls) to measure market volatility. When prices rise, the bands get wider, and when prices fall, they get narrower.
There are three lines or bands on the chart that make a channel enclosing the price movements and capture price fluctuations. The evaluation of the price channel contributes to forming trading signals. These bands are:
- Upper Band: The upper band indicates the upper boundary of price volatility and is calculated by adding a particular number of standard deviations (usually 2) of price to SMA.
- Middle Band: The middle band is the SMA or EMA and acts as the baseline for the lower and upper bands. Its parameters are chosen by the trader.
- Lower Band: The lower band indicates the lower boundary of price volatility and is calculated by subtracting the same number of standard deviations from SMA.
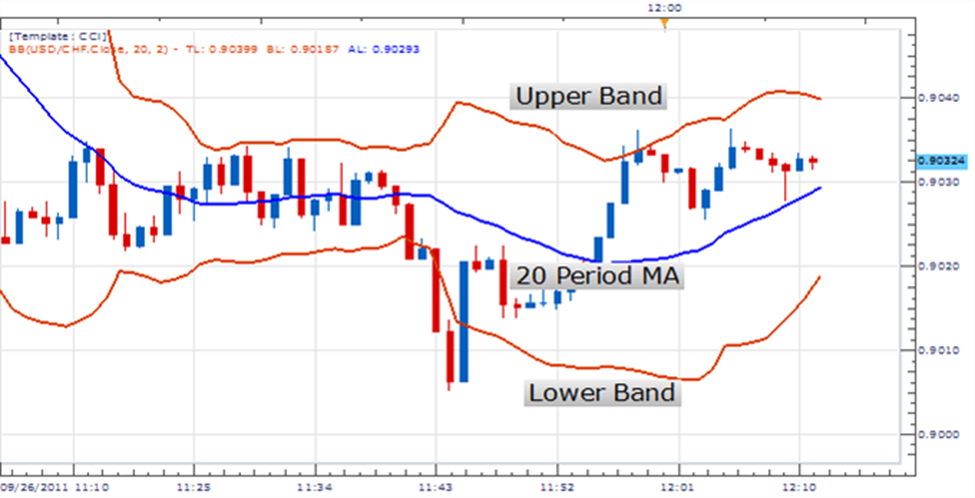
Bollinger Bands are plotted using a reference line that may be an Exponential Moving Average (EMA) or Simple Moving Average (SMA) over N periods (usually 20 days for short-term analysis and 200 days for long-term analysis). The upper and lower bands are placed on either side of the moving average line and create a price envelope.
Because of their dynamic character, Bollinger Bands can be applied to a wide range of securities trading with standard settings to understand price fluctuations and measure overall trends. Technical analysis of the price can be used to ascertain overall trends. A price that consistently trades above the middle band is said to be in an upward trend; a price that consistently trades below the middle band is said to be in a downward trend.
The trader determines the number of standard deviations required to set the volatility indicator. This number, in turn, decides the distance between the upper and lower bands and the middle band. The locations of these bands offer information regarding the strength of the trend and probable high and low price levels that can be anticipated shortly.
Moreover, the indicator helps discover overbought and oversold conditions in the market while trading. An overbought scenario is when the security’s price moves above the upper band, and an oversold scenario is when the price moves below the lower band.
Combining Bollinger Bands and the Ichimoku Indicator for a Reliable and Effective Trading Strategy
Combining Ichimoku Cloud with other technical analysis tools like Bollinger Bands can strengthen confirmation signals of your trade. This combination provides a deeper analysis of market trends and improves your analytical capabilities, offering greater confidence in the trades you participate. Bollinger bands, which are based on a standard deviation and a moving average, can be used by traders to gauge market volatility and deviation as well as spot overbought and oversold situations.
By combining Ichimoku Cloud with Bollinger Bands, traders can determine the strength and direction of the trend by analyzing the divergence and alignment of the bands and the cloud. They can identify possible entry and exit points by examining the price and cloud bounces or breakouts. They can manage risk and reward by employing bands and the cloud as stop-loss or take-profit levels or as trailing stops. Moreover, traders can prevent false signals by filtering out signals occurring in the opposite direction of the cloud or outside the bands.
Let us discuss them in greater depth:
Spotting Direction of the Trend
Bollinger Bands give a measure of volatility, but Ichimoku Cloud is excellent at identifying trend direction. When the Bollinger Bands widen, and the price is significantly trending in a single direction (validated by the alignment of Tenkan-sen and Kijun-sen), this suggests a strong and volatile trend and may offer trading chances.
Confirming Trend Direction
Combining technical indicators such as Ichimoku Cloud and Bollinger Bands can help confirm the trend direction. The chance of accurate signals improves when multiple trend indicators point in the same direction of trend.
Identify Breakout Opportunities
Traders can find possible breakout opportunities by combining Bollinger Bands with Ichimoku Cloud. A time of low volatility is indicated when the price is consolidated inside the Ichimoku Cloud and the Bollinger Bands are getting narrower. But when the price breaks out of the Ichimoku Cloud, and the Bollinger Bands begin expanding, it suggests a potential trend continuation or reversal signal. This combination enables traders to identify high-probability trades and profit from the momentum in the market.
Confirming Breakouts
Bollinger Bands or cloud breakouts generate trading signals, which is quite important. A bullish TK crossover (Tenkan-sen line crossing over Kijun-sen) in Ichimoku Cloud, along with expanding bands, indicates a strong bullish momentum and may be a sign of a buying opportunity when the price breaks over the cloud or the upper Bollinger Band. On the other hand, a bearish TK crossover and contracting bands, along with a breakout under the cloud or the lower Bollinger Band, could indicate a selling opportunity.
Confirming Volatility
Bollinger Bands widen during times of high volatility and contract during times of low volatility. By combining this data with the trend analysis provided by Ichimoku Cloud, traders can determine how strong a trend is. For instance, expanding Bollinger Bands during a strong uptrend validated by Ichimoku Cloud indicates growing bullish momentum, strengthening the belief to remain in the trade.
Strong Trading Signal
The combination of Ichimoku Cloud and Bollinger Bands works effectively. A strong trade signal may be indicated by the convergence of the Bollinger Bands and Ichimoku Cloud indicator. When the price breaks above both the middle band and the cloud at the same time, the likelihood of the price moving much higher increases.
Support and Resistance Levels
Bollinger Bands offer static support and resistance levels through the upper and lower bands, while Ichimoku Cloud provides dynamic support and resistance levels with Senkou Span A and Senkou Span B. The alignment of these levels reinforces the significance of resistance or support, hence improving the dependability of trading decisions.
Risk Management
Traders can apply efficient risk management techniques by combining both indicators. Contracting Bollinger Bands or a cloud twist (Senkou Span A crossing above Senkou Span B for a bullish signal and oppositely for a bearish signal) can suggest a possible trend reversal or consolidation phase. This can prompt traders to modify their positions or tighten stop-loss orders appropriately.
Here is What Else to Consider
The following points should be kept in mind while combining Bollinger Bands and Ichimoku indicator.
- Continuous Monitoring and Adaptation: Keep a close eye on the effectiveness of your combined indicator approach and make the required modifications in response to changing market conditions. Strategies are dynamic and must be adjusted to changing market conditions.
- Backtest and Optimize: Backtest your combined indicator technique on historical data to evaluate its performance. To confirm the best outcomes, optimize the parameter of every indicator. Steer clear of over-optimization since this could result in curve-fitting.
- Avoid Overloading Charts: Take care not to overload your chart with lines and shapes when you combine indicators. Achieve a balance between thoroughness and graphical legibility.
- Learn and Improve: Learn from the results of your integrated indicator strategy continuously. Evaluate both profitable and unprofitable trades to refine your approach over time.
Conclusion
Combining Ichimoku Cloud and Bollinger Bands into a trading strategy gives traders a comprehensive approach to analyzing volatility, market trends, and possible entry and exit positions. Although every indicator has its own advantages, when combined, they give traders a more thorough grasp of market dynamics and increase the likelihood of successful trades. However, before placing trades using this approach alone, it’s critical to follow appropriate risk control procedures and confirm trading signals with other technical tools. As for any strategy in Forex trading, continuous learning, discipline, and adaptation are crucial for long-term success and profitability.


