

As a trader, understanding how to analyze volume and price movements can be the key to success in the markets. One popular approach to this analysis is Volume Price Analysis, which looks at the relationship between volume and price to identify trends and potential trade opportunities.
In this blog, we’ll explore Volume Price Analysis, how it works, and how you can use it in your trading strategies.

What is Volume Price Analysis?
Volume Price Analysis is a method of technical analysis that uses the relationship between trading volume and price movements to identify market trends and predict future price movements.
It assumes that changes in price and volume are related and that analyzing the two together can provide insight into market sentiment and potential trade opportunities.
Volume Price Analysis focuses on identifying two key indicators:
- Volume: The number of shares, contracts, or units traded during a given period.
- Price: The market price of a security or commodity.
By analyzing the relationship between these two indicators, traders can identify trends and make informed trading decisions.
Essential Strategies for Volume Analysis
Volume analysis is a technique used in trading to analyze the relationship between trading volume and price movements.
Here are some volume-related indicators:
- The money flow index – MFI is a momentum technical indicator that measures the flow of money into and out of an asset over a specified period of time.
- Volume-weighted moving average – VWMA is a technical indicator that measures the average weighted price by volume throughout N bars.
- Volume oscillator – The Volume Oscillator displays the difference between two moving averages of a security’s volume expressed as a percentage.
It helps traders to understand the strength or weaknesses of a trend and make informed trading decisions. Here are some important strategies for volume analysis:
-
Confirm trend strength
One of the most important strategies for volume analysis is to confirm the strength of a trend. A strong trend is typically characterized by high trading volume, while a weak trend is characterized by low trading volume.
By analyzing the volume that accompanies price movements, traders can confirm the strength or weakness of a trend and make more informed trading decisions.

- Identify support and resistance levels
Volume analysis can also help traders to identify key levels of support and resistance. When the volume increases as the price approaches a certain level, it indicates that the level is being tested.
If the volume is high, it suggests that the level is likely to hold and the price is likely to bounce back. On the other hand, if the volume is low, it suggests that the level is likely to be broken, and the price may continue to move in the same direction.
- Spot divergences
Divergence occurs when the price and volume do not move in the same direction. For instance, if the price is increasing, but the volume is decreasing, it indicates that the trend may be losing momentum and may soon reverse.
Conversely, if the price is decreasing, but the volume is increasing, it suggests that the trend may be gaining momentum and may soon reverse. By using volume analysis to spot divergences, traders can anticipate potential trend reversals and adjust their trading strategies accordingly.
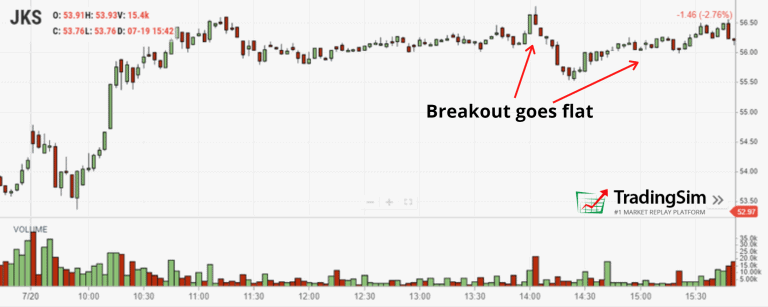
- Identify breakouts
Volume analysis can also help traders to identify key breakouts in the market. A breakout occurs when the price breaks through a key level of support or resistance. If the volume is high when the price breaks through the level, it indicates that the breakout is significant and is likely to continue.
On the other hand, if the volume is low when the price breaks through the level, it suggests that the breakout may be false, and the price may soon return to the previous level.
- Use a volume with other indicators
Volume analysis can be combined with other indicators to improve trading decisions. For instance, traders can use volume analysis with moving averages to identify trends and potential trend reversals.
They can also use volume analysis with the Relative Strength Index (RSI) to identify overbought or oversold conditions. By combining volume analysis with other indicators, traders can get a more comprehensive view of the market and make more informed trading decisions.
Stair-step Approach
The second strategy we will talk about is the stair-step approach, you must see the volume increase on each successive high and decrease on each pullback. The underlying message is that there is more positive volume as the stock is moving higher.
It confirms the health of the trend. Such confirmation in the volume activity is generally an outcome of a stock in an impulsive phase of the trend.
Volume Spikes
The third strategy is volume spikes. These are frequently the result of news-driven events. However, no matter the cause, you need to study the spike in price action.
A spike is defined as an increase of at least 500% more in volume over the recent volume average, leading to sharp reversals, since the moves are unsustainable because of an imbalance in supply and demand. Trading counter to volume spikes is profitable. However, it requires great skill and mastery of volume analysis.
On-Balance Volume
Joseph Granville, who is considered an important person in technical indicators, developed this strategy. It is an essential leading indicator, based on whether the prices of commodities close higher or lower in the past performance, the previous day. However, a key fact to note here is that the indicator rises or falls before the actual price of the assets is marked.
So, when you apply on-balance volume, a new high represents the power of the bulls and the weaknesses of the bears, which will lead you to a buying opportunity. However, on the other hand, a new on-balance low volume is representative of a bear stock market. A last thing to note here is that, when on-balance volume shows a signal, which is different from the actual prices, it is showing a shift in price, or we can say that it is a divergence.

Accumulation/Distribution (A/D)
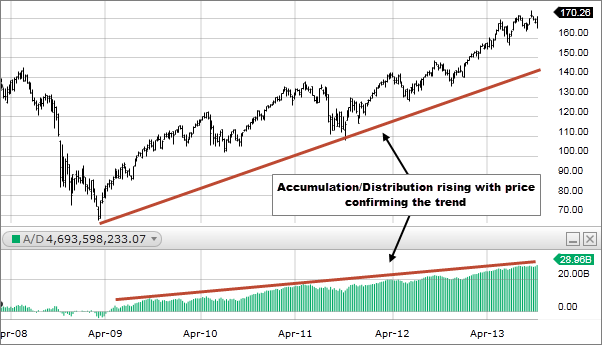
Accumulation/Distribution (A/D) is a technical analysis indicator that measures the flow of money into or out of a security over a specified period of time. The A/D indicator is based on the premise that price movements and volume are directly related.
When volume and price both increase, it suggests buying pressure and accumulation of security. Conversely, when volume and price both decrease, it suggests selling pressure and distribution of the security.

The A/D indicator calculates the cumulative total of the security’s volume and price changes to determine whether the security is being accumulated or distributed. Traders and investors use the A/D indicator to identify potential trend reversals and confirm existing trends.
A rising A/D line indicates buying pressure and accumulation, while a falling A/D line suggests selling pressure and distribution. The A/D indicator is a valuable tool for technical analysis and can be used in conjunction with other indicators to help identify potential trading opportunities.
Conclusion
If you use the strategies contained in this blog, it will give you a boost in success and help you achieve profits to the maximum potential.
It is an important technique used in trading to analyze the relationship between trading volume and price movements. It helps traders to understand the strength or weaknesses of a trend and make informed trading decisions.


