


The KST Oscillator (Know Sure Thing) is a powerful momentum-based trading indicator designed to smooth out market noise and generate clear trend-following signals.
Developed by Martin Pring, the KST Oscillator combines multiple timeframes of rate-of-change (ROC) data into a single, easy-to-interpret line.
In this comprehensive guide, you will learn how to read the KST indicator, calculate its values, and use its buy/sell signals to improve your trading strategy.
What is the Know Sure Thing – KST Oscillator?
Know Sure Thing Indicator or KST oscillator is a momentum-based oscillator, which is a component of the oscillators family in technical analysis. It is used by analysts to forecast the price momentum across different markets.
First proposed in Stocks and Commodities Magazine in 1992, it was introduced in the paper “Summed Rate of Change (KST),” which outlined the concept behind Martin Pring’s KST indicator. The KST indicators are based on the smoothed rate-of-change (ROC) for four different timeframes and are displayed as graphical oscillators. They accomplish this by fusing four different price cycles into a single momentum oscillator, enabling analysts and chartists to, among other things, look for divergences.
Like all other momentum oscillators, the KST indicator can help traders find buy and sell signals produced by:
- Crossover signals
- Centerline crossovers
- Bullish and bearish divergences
- Overbought and oversold readings
Moreover, Pring’s Know Sure Thing Indicator can be employed in the same way as several other momentum oscillators like the popular relative strength index (RSI). KST can signal the likely overbought and oversold readings as well as the potential signals for buy and sell entries.
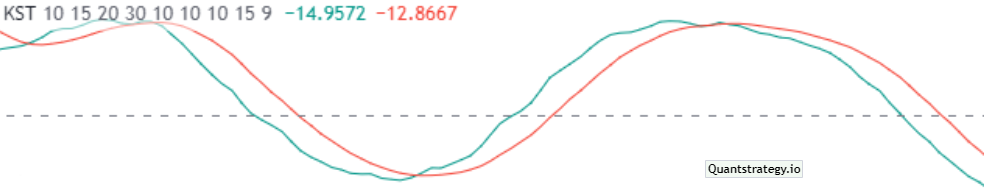
It comprises three lines – the baseline, the KST line (red), and the signal line (green). The crossovers and interaction between the line can help traders better analyze the direction of the market.
Buy Signals
- Zero line crossover: When the Know Sure Thing (KST) crosses above the zero line, it activates a buy signal. An uptrend is confirmed when the KST indicator holds above the zero line for a long duration.
- Signal line crossover: When the KST indicator line crosses above the signal line, it can be a bullish signal, indicating that the trend is likely to continue upward.
- Bullish divergence: When the price of an asset is moving in a downward direction, but the KST indicator is moving in the upward direction, it can be a sign of a potential trend reversal. This is known as divergence and can be a powerful signal for traders.
- Oversold: When the KST indicator reaches extreme levels, below a certain negative threshold, it can be a sign that the market is oversold. This can indicate that a reversal in the trend is likely to occur soon.
Sell Signals
- Zero line crossover: When the Know Sure Thing (KST) crosses below the zero line, it activates a sell signal. A downtrend is confirmed when the KST indicator holds below the zero line for a long duration.
- Signal line crossover: When the KST indicator line crosses below the signal line, it can be a bearish signal, indicating that the trend is likely to continue downward.
- Bearish divergence: When the price of an asset is moving in an upward direction, but the KST indicator is moving in a downward direction, it can be a sign of a potential trend reversal. This is known as divergence and can be a powerful signal for traders.
- Overbought: When the KST indicator reaches extreme levels, above a certain positive threshold, it can be a sign that the market is overbought. This can indicate that a reversal in the trend is likely to occur soon.
Now let us see how the KST is calculated.
How to Calculate the Know Sure Thing Indicator?
To calculate the KST oscillator, you need to follow a specific formula.
Firstly, you should take the simple moving average (SMA) of four different rate-of-change (ROC) periods, add these four SMAs together, and then take the KST’s 9-period SMA to create a signal line.
The Know Sure Thing (KST) is calculated with the following formula:
Indicator Line
KST = (1 x MAROC1) + (2 x MAROC2) + (3 x MAROC3) + (4 x MAROC4)
Where:
MAROC1 = 10-Period SMA (Simple Moving Average) of 10-Period ROC (Rate of Change),
MAROC2 = 10-Period SMA (Simple Moving Average) of 15-Period ROC (Rate of Change),
MAROC3 = 10-Period SMA (Simple Moving Average) of 20-Period ROC (Rate of Change),
MAROC4 = 15-Period SMA (Simple Moving Average) of 30-Period ROC (Rate of Change).
Signal Line
KST Signal Line = 9-Period SMA of KST Indicator
What are KST Default Settings and How to Plot it?
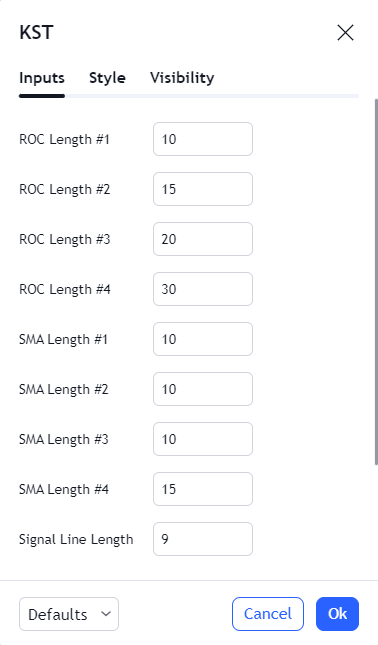
The default KST indicator setting has some parameters, which are as follows:
KST (10, 15, 20, 30, 10, 10, 10, 15, 9).
Traders can choose any 9 periods based on their trading style and preference.
The breakdown of each of these KST indicator parameters is:
-
The first four numbers represent the ROC settings, where each number indicates the number rate of change periods. These are incorporated into each SMA (simple moving average).
-
The second four numbers denote the Moving Averages for these ROCs.
-
The last and final number represents the signal line Moving Average period. It allows traders to recognize and deploy crossovers to their benefit.
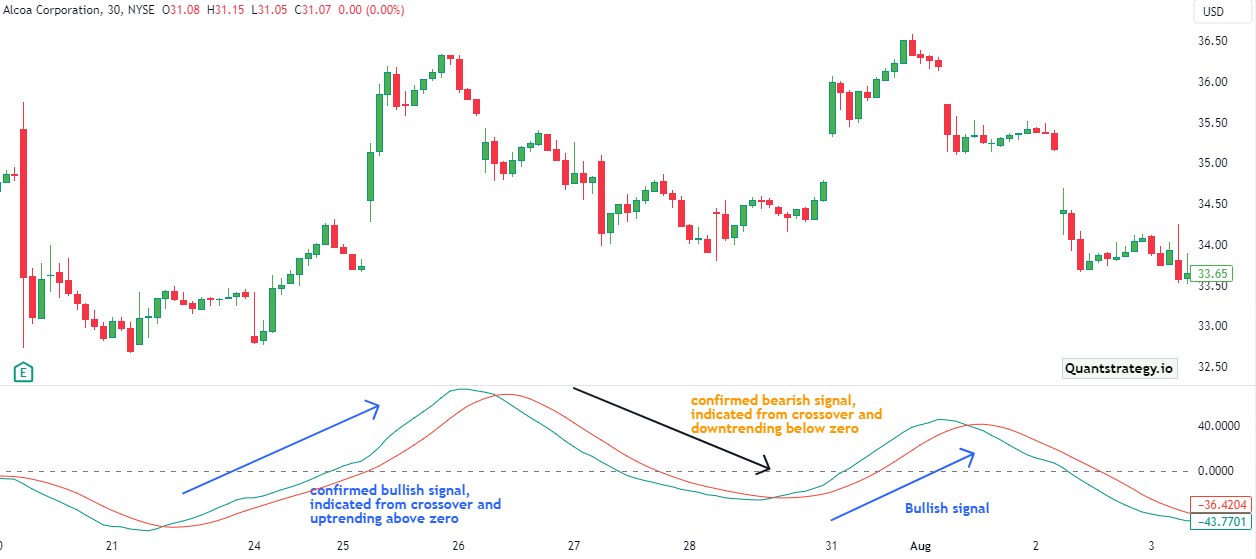
Let us consider an example to understand how we can plot the KST. The picture below demonstrates the 30-minute Alcoa chart from 1-23 June.
9 periods have been selected from the KST indicator line.
Now that we know about the features of the KST indicator, let us see how it can be used in trading.
How to Use the KST Oscillator?
The KST oscillators can be applied in several different ways. According to our evaluations, the majority of traders employ it to identify divergences, reversals, and trends.
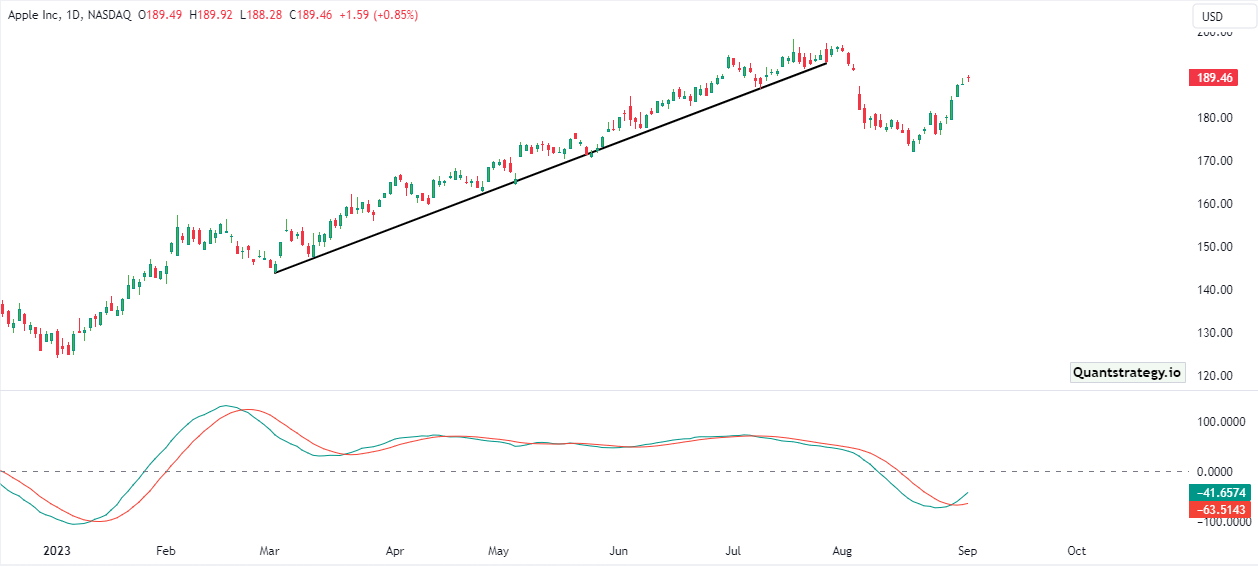
KST Indicator for Trend Following
In a trend-following strategy, you either short an asset whose price is already decreasing or buy one whose price is growing. The objective is to go with the flow till it is over. Newton’s law of motion, which states that an item moves until it encounters a force in an equal and opposite direction, is applied through trend following.
The KST oscillator is employed in trend following in a fairly straightforward manner. Finding an asset whose price is already growing or dropping is the first step. You then use the KST indicator in the second step.
Lastly, consider the Know Sure Thing indicator’s general trend. The asset’s price should ideally remain in the same direction regardless of whether the indicator is growing or declining. When the indicator’s two lines cross, a selling or exit signal will appear.
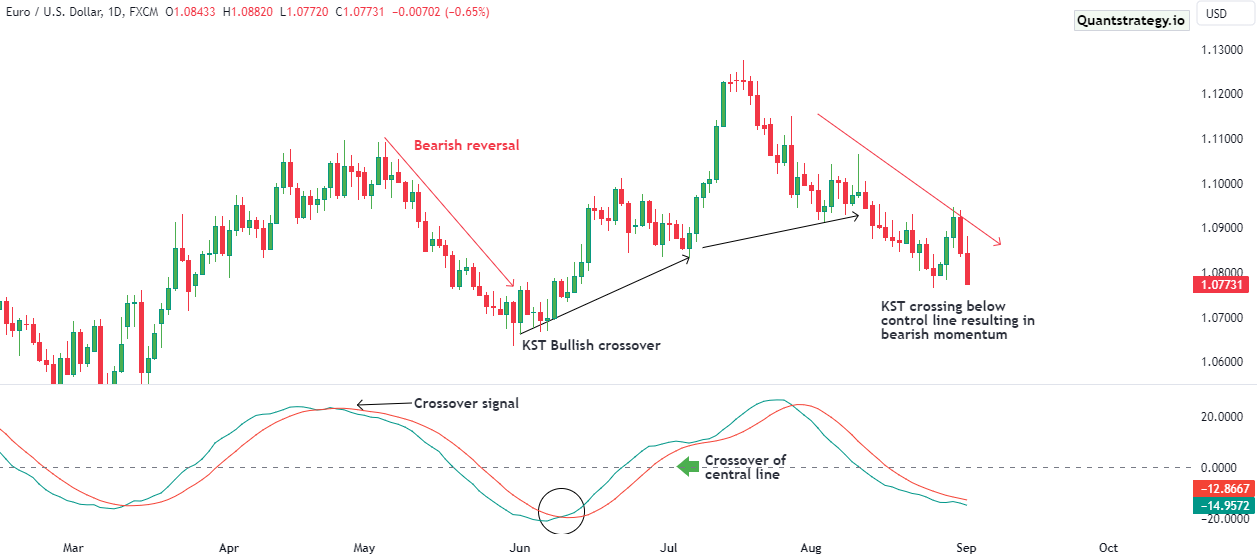
The KST’s role in trend following is demonstrated in the illustration below. The asset price remains on an upward trajectory. See the below chart.
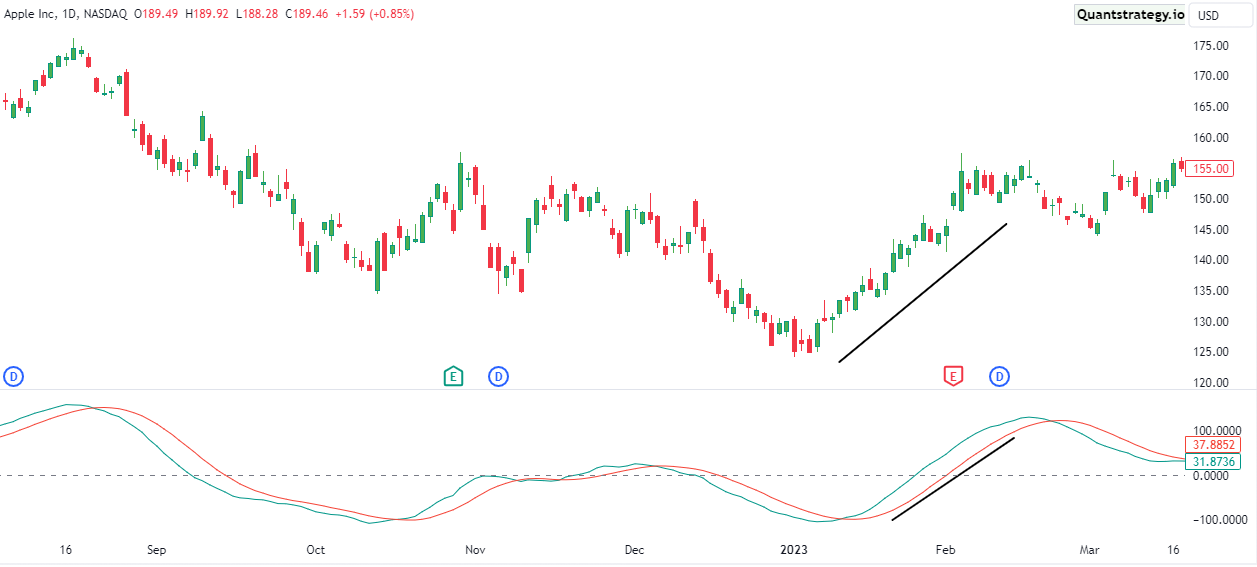
KST for Finding Reversals
A reversal occurs when the price of an asset changes direction. Or putting it another way, a bearish reversal occurs when the rising asset price reverses. Similarly, a bullish reversal occurs when the asset’s price shifts and continues to rise.
Therefore, there must be a trend in the first place for a reversal to occur. You can use the KST term to spot reversals by observing an instance where the two lines cross. The following example displays this.
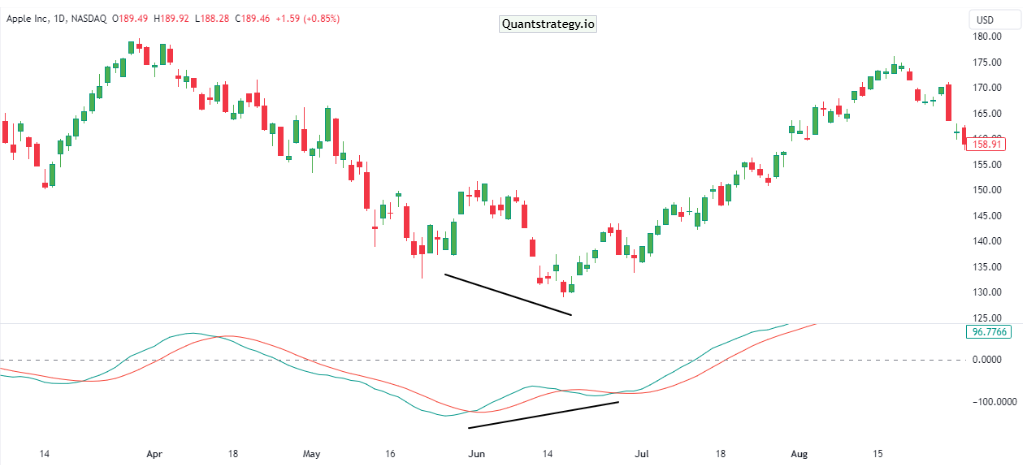
KST for Finding Divergences
The next KST strategy is to look for divergences. First of all, divergence occurs when the price of an asset goes in one direction while the indicator moves in a different direction. When this occurs, it only indicates that the overall bullish or bearish trend is fading its momentum. The chart below provides an excellent illustration of this strategy.
Limitations of Know Sure Thing Indicator
Like any technical analysis tool, the KST (Know Sure Thing) indicator has its limitations.
One of the biggest limitations is that it is a lagging indicator, meaning that it uses past price data to generate signals. This can make it less effective in volatile markets where prices are rapidly changing.
Another limitation of the KST indicator is that it is a complex tool that requires a significant amount of time and expertise to properly understand and use. This can be a challenge for novice traders who are just starting to learn about technical analysis.
the KST indicator is not foolproof and can generate false signals. Traders should be aware of the limitations of the KST indicator and use it in combination with other technical analysis tools to confirm signals and make informed trading decisions.
Conclusion
The KST indicator is a well-known tool deployed in market analysis and day trading as it gives a pretty thorough overview of both short-term and long-term price patterns. It identifies four different cycles and builds on the smoothed rate of change across four different time periods.
Once traders master the KST indicator’s usage, they can spot momentum bursts ahead of time, creating more accurate and comprehensive strategies.
However, there are a few weaknesses in the KST. Traders are encouraged by Martin Pring to experiment with the indicator’s settings. For less volatile markets, more sensitive settings are needed, and vice versa.
It is impossible to determine the oversold and overbought zones using Pring’s oscillator. However, it provides reliable trading signals when the indicator’s lines cross each other and when it breaks the trend line it has drawn around itself.
Instant Backtest
Forget guessing how an indicator might perform; our instant backtesting data gives you the answers.
We’ve done the heavy computational lifting so you can focus on making informed decisions.


