To make intraday trading simpler, traders use a variety of strategies that demand active attention to market trends. The pivot point indicator is one of these methods. Traders have relied on pivot points for decades. They serve as a crucial turning point in a stock’s or security price that traders frequently trade around.
Pivot points provide insightful information on price movement and market sentiment. This multifaceted indicator uses data from the preceding period to create a series of levels that may be used by traders to determine price direction and identify possible support and resistance levels.
Irrespective of your experience level, knowing how to calculate and apply pivot points to your trading strategy can be a useful addition to your toolset. This article aims to impart a thorough understanding of pivot points, outline any potential drawbacks, and detail how to use them as a part of your overall trading plan.
What are Pivot Points?
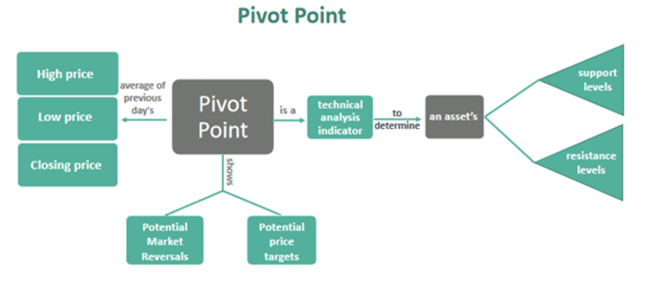
Pivot points are a technical analysis indicator to analyze price action and determine possible support and resistance level in various financial markets, including indices, forex, stocks, and commodities. They’re based on the previous day’s high, low, and closing prices. This aids traders in determining market patterns at different time points. The support and resistance levels provided by pivot points can, in turn, be used as potential entries, exits, stop losses, and profit targets for trades.

Pivot points were initially introduced by floor traders who operated in the fast-moving stock and commodities markets. This was in the early 20th century, and it later gained immense popularity among retail traders and technical analysts. They would determine the pivot for the current trading day at the beginning of each trading day using the previous day’s high, low, and close prices.
The pivot point is then utilized to determine the two support and two resistance levels for the day. Based on the difference between the pivot point and the high and low prices of the prior day, the support and resistance levels are established.
Pivot points are often used together with other technical indicators to make trading decisions.
Pivot Points: Interpretation
Pivot points are static and remain at the same prices throughout the day. This implies that traders can use the levels to aid in the planning of their trades in advance.
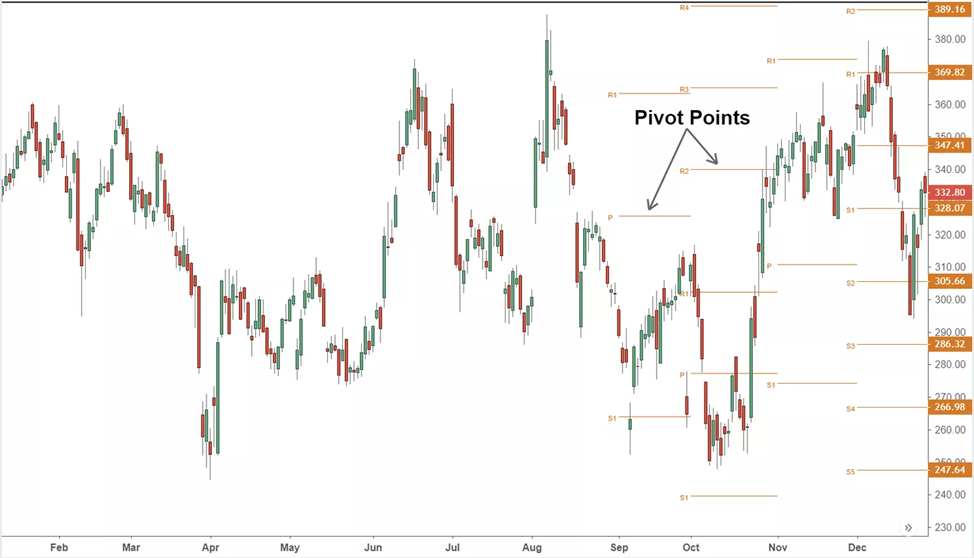
There are three pivot point levels: the pivot point (P), the support (S), and the resistance (R). The main pivot point acts as a reference point and the support and resistance levels serve as possible barriers for price movements.
Price will aim for resistance barriers if it is higher than the pivot point. On the other hand, it will move to support levels if it is below the pivot. Thus, support and resistance levels act as stop-loss and target zones. They remain steady over time, allowing traders to make plans in advance.
Along with the pivot point, several additional support and resistance levels are computed based on the pivot point. These are the resistance levels R1, R2, and R3 and the support levels S1, S2, and S3.
Traders use points to determine probable price levels where the market might reverse course and establish prospective price targets.
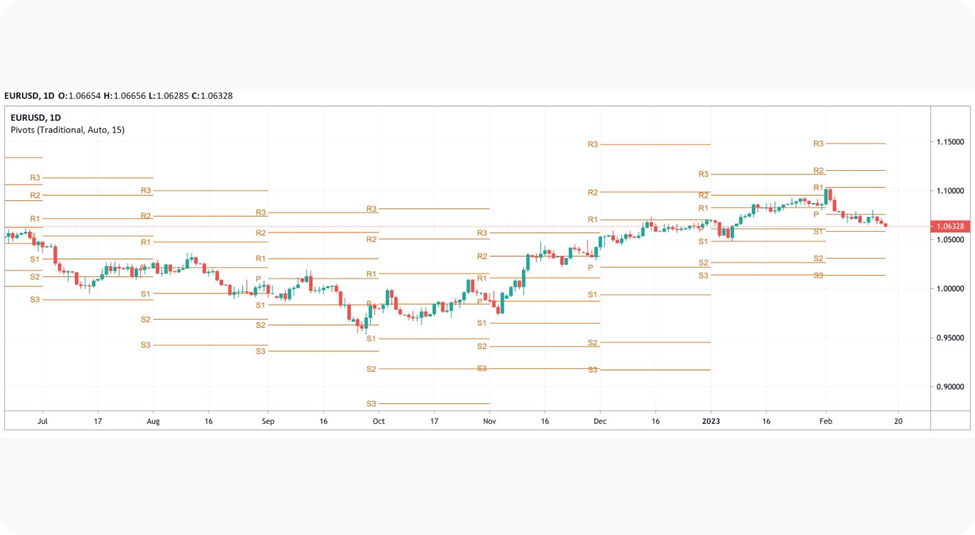
Since the price is below P in the EURUSD daily chart below, it is presumed that the market is bearish. Future areas of interest (support) are indicated by S1. A shift above P would signal bullishness, and R1 would then act as a liquidity draw and resistance.
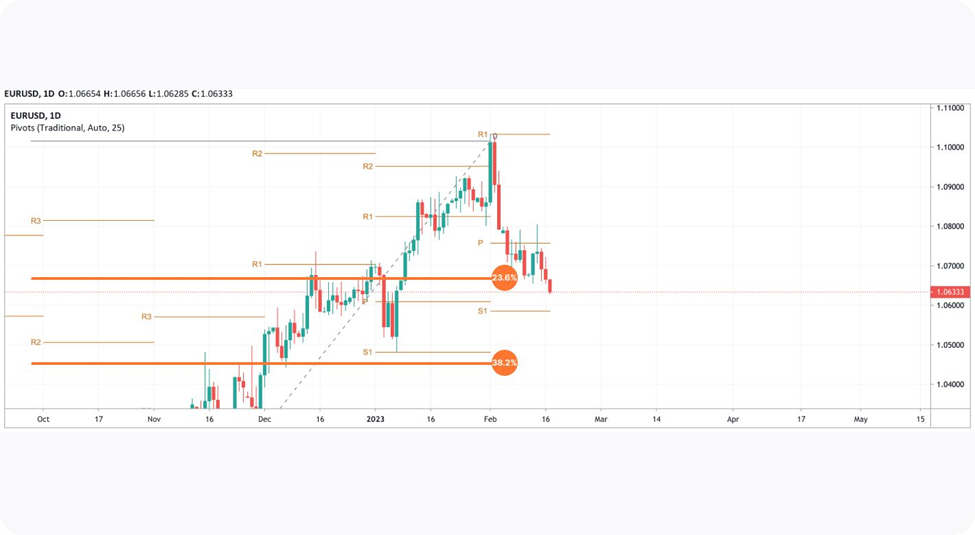
As mentioned earlier, the pivot point is widely used in combination with technical indicators like Fibonacci tools and moving averages. Fibonacci retracements can be used to locate intermediate levels of support and resistance inside widely spaced pivot points in the chart below.
Moreover, as they can reveal important information about the strengths or weaknesses of the market, traders should pay close attention to how the price responds to these levels. A trend continuance or reversal may be indicated by a break above or below a pivot point level, while a rebound off a pivot point level may signify a brief retracement.
Calculating Pivot Points
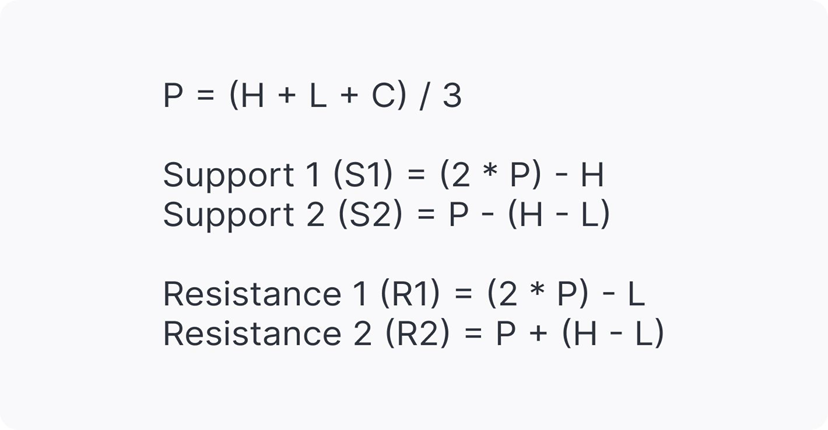
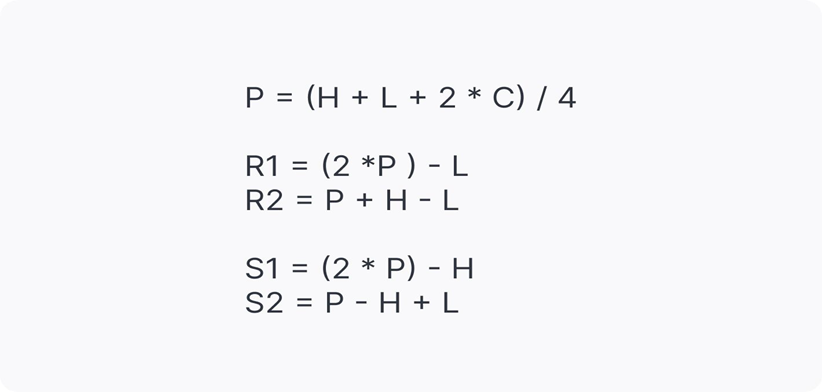
The five-point system is the primary method most traders use to calculate pivot points. The system uses the support and resistance levels as well as the high, low, and closing prices from the prior day. The following equations are used in the five-point system:
Pivot Point (PP) = (High + Low + Close)/ 3
S1 = (2 x PP) – High
S2 = PP – (High – Low)
S3 = S1 – (High – Low)
R1 = (2 x PP) – Low
R2 = PP + (High – Low)
R3 = R1 + (High – Low)
Where
S1 = Support 1
S2 = Support 2
S3 = Support 3
R1 = Resistance 1
R2 = Resistance 2
R3 = Resistance 3
The levels will automatically be calculated and displayed when the pivot point indicator is added to a chart. Here’s how to calculate them on your own, bearing in mind that pivot point is typically utilized by day traders and depends on the high, low, and close from the previous trading session.
If it’s Wednesday morning, use Tuesday’s high, low, and close to set the pivot point levels for Wednesday’s trading session.
-
Find the day’s high and low, as well as the close from the most recent trading day, either after the market closes or before it opens the following day.
-
Add up the high, low, and close, and divide the result by three.
-
Designate this price as P on the chart.
-
After determining P, calculate S1, S2, R1, and R2. These calculations use the high and low from the previous trading day.
Types of Pivot Points
Pivot points come in various types that are used in trading. Although they are automatically computed when used on a price chart, it is important to consider the pivot point calculator formula to comprehend their differences. These are the most common types:
-
Standard Pivot Points
Standard pivot points are the most widely used form of pivot point and are established using the high, low, and closing prices from the previous day. While a standard pivot point is effective, it can generate false signals and result in improper trades in range markets and during periods of extreme volatility.
-
Fibonacci Pivot Points
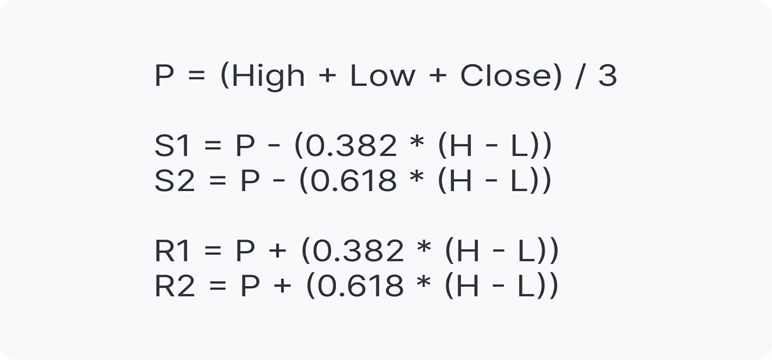
Fibonacci pivot points are based on the Fibonacci sequence of numbers. The high and low of the prior trading day are utilized to calculate these levels, which are then employed to determine potential levels of support and resistance.
Fibonacci pivot points are calculated in the way as the standard pivot points. However, the Fibonacci sequence is added to establish the levels of support and resistance, with the 38.2% and 61.8% retracement levels being closely monitored as the main price points.
-
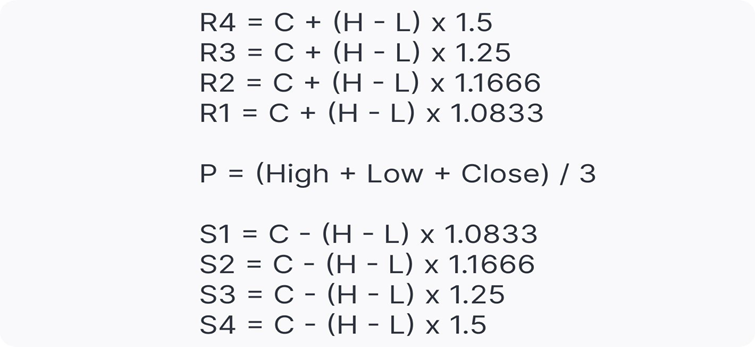
Camarilla Pivot Points
The formula used to determine camarilla pivot points differs from that used to determine standard pivot points. These levels are made to offer more intense support and resistance.
Camarilla pivot points use the volatility of the prior trading period to establish pivot levels that are more accurate in short-term trading since they are closer to the present price.
-
Woodie’s Pivot Point
Woodie pivot points are calculated using the high, low, and opening prices from the prior day. These levels are especially helpful in moving markets and suggest potential points of support and resistance.
Woodie pivots are comparable to standard pivots, however, the calculation has been slightly modified. The close price is given more importance when using the Woodie pivot points method.
-
Demark pivot points
Demark pivot points use a different foundation and a unique formula for support and resistance. These pivot points depend on how the opening and closing prices are related.
The Reasons Why Day Traders Prefer Pivot Points
Day traders frequently choose to use pivot analysis over other leading indicators for several reasons. These include:
-
High precision
Pivot points are regarded as one of the most precise indicators in the market. This explains why a lot of days traders prefer to use it to pick entry or exit points for trades. Since it uses the trading activity of the earlier day to predict the likely action of the current day, it enables traders to enter the market to follow the market’s overall flow.
-
Brief time frames
Pivot points gather data from a single trading day, in contrast to other trading tools that employ lengthy time frames. It employs the previous day’s high, low, and close prices to forecast potential support and resistance levels. Even though pivot point trading is typically used on the daily time frame, pivot point can also be calculated for much shorter time frames, including hourly or 15-minute charts.
-
User-friendly
Pivot points are a straightforward tool that can be found in the majority of trading platforms. The platforms automatically conduct the support and resistance level calculations for the trader. This saves them from manual labor. After obtaining the pivot points, the trader can focus on determining their strategy for the day’s market.
-
A Rich Set of Data
Pivot points offer a wide range of data on charts. As mentioned above, the indicator has seven unique trading levels (PP, S1, S2, S3, R1, R2, R3). This is sufficient to get a day trader through the trading session.
-
Particular to Day trading
The pivot points calculation uses data from the previous trading sessions and applies it to the current trading day. This way, the levels you are viewing only apply to the current trading day. As a result, the pivot points are the most distinctive indicator available for day trading.
Uses of Pivot Points
The pivot point system can be used to:
-
Determine the overall market trend
Depending on how the price action is moving, traders can identify market trends using pivot points. The market is bearish when the price action stays at or declines below the pivot level. The market is bullish, however, when price activity stays or crosses above the pivot point.
-
Identify possible entry and exit points
Traders can determine optimal entry or exit points using pivot points. For instance, traders may go long if the price rebounds off a support level or may go short when the price reverses from a resistance level.
-
Place stop-loss orders
Traders can place appropriate stop-loss orders using pivot points. They can set stop-loss orders above resistance levels for short positions and below support levels for long positions.
-
Set profit targets
Traders can use a pivot point to set profit targets by predicting the following level of support or resistance as the price swings in their favor.
-
Confirm trading signals
Pivot points can be used in conjunction with other forms of technical analysis to confirm trading signals and uplift the possibility of successful trades. These other technical indicators can be anything from MACD to RSI or using moving averages to determine a trend direction.
Trading with Pivot Points
There are some basic guidelines traders follow while using pivot points:
Day trading with pivot points is typically used for M30 and shorter intraday timeframes with pivots based on the previous day’s high, low, and close prices. Levels are revised daily, permitting traders to respond quickly to market fluctuations and modify their tactics.
For long-term analysis, weekly pivots are added to H1, H4, and D1 charts. These are determined using the high, low, and closing prices from the previous week, which don’t change until the beginning of the next week.
Traders utilize monthly pivots on weekly charts for additional longer-term insight. These levels provide a more comprehensive picture of market patterns and price changes over time because they are based on data from the preceding month.
Additionally, this indicator can be traded with the following pivot point trading strategies:
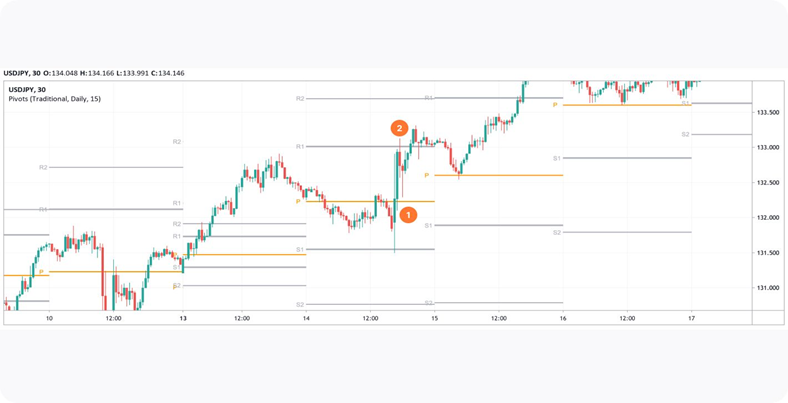
Pivot Point Breakout Strategy
When the price breaks above or below the levels of support or resistance, traders may consider them as an opportunity to enter a trade. It is more likely that prices will decline when levels P and S1 are broken, and the price closes below either if the breakout is bullish.
Both instances require significant market volume and strong momentum for prices to rally.
Traders may enter a trade in the breakout direction if a breakout is confirmed (1). A take-profit target is typically set at the following pivot level (2). In a buy or sell trade, a stop-loss level can be set below the support level or above the resistance level, or it can be determined using a risk/reward ratio. Traders must regularly check their positions and modify their stop-loss settings to lock in winnings as prices move in their favor.
Pivot Point Bounce Strategy
You should place the trade in the direction of the bounce if the price action pauses and then bounces back before hitting the pivot level. If the price moves near the pivot line while you are testing the trade, and it then bounces back to the upside, you must enter a long (buy) trade.
On the other hand, you should sell short if you are testing a pivot line from the bottom and the price bounces back down after hitting the pivot. If the trade is short, the stop-loss is placed above the pivot line; if the trade is long, it is placed below the pivot line.
Pivot Point Swing Strategy
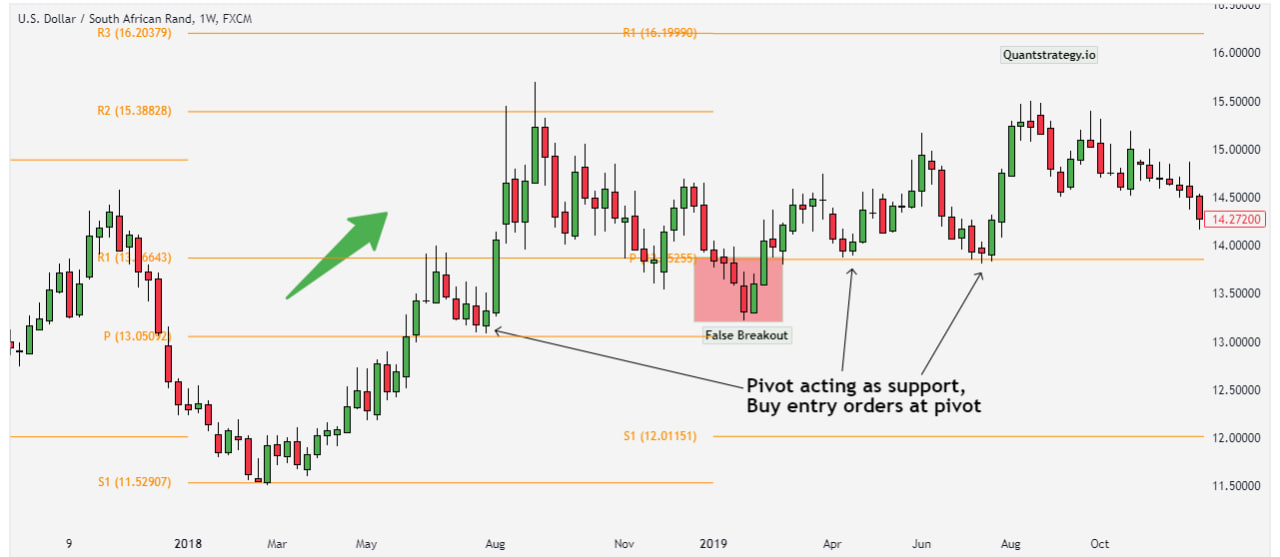
Swing trading with the pivot point is achievable by using weekly or monthly time frames for traders who wish to engage in medium- to long-term trades.
The pivot point is the only addition to the weekly chart in the chart below (this can be changed by modifying the platform’s pivot settings). There has been an upside trend reversal following the price’s breakthrough of the prior pivot resistance.
Traders can now place long entry orders at the pivot point price because it is currently functioning as a support level. Though there’s a false breakout (blue circle), there is still a significant amount of upside after this that might be taken advantage of. Even though the pivot levels don’t always hold the price, they do provide a price level where the directional bias can be maintained. This would be a longer time horizon, which is perfect for swing traders.
The above example is illustrated in the USD/ZAR weekly chart.
Limitations of Pivot Points
Some traders find pivot points to be a valuable calculation, but the results are never certain. They can be used to identify opportunities as part of a larger trading strategy, but it’s crucial to keep in mind that the price might not always take such possibilities up. Although there is no assurance that pivot points will produce consistent gains, day traders can gain an advantage in their analysis and trades by incorporating them into their trading strategies.
Pivot points offer a framework for comprehending price activity, but their ability to predict future price movement is limited. Trading professionals should employ pivot points in conjunction with other technical and fundamental analysis tools rather than solely relying on them.
Conclusion
A pivot point is a flexible and popular technical indicator that can assist traders in identifying probable market support and resistance zones. While they have many benefits, such as straightforward calculations and objective analysis, their limitations, such as limited predictive power, cannot be overlooked. It triggers responses. Although the points may not ultimately be agreed upon by the market, the fact that they elicit a response makes them an important point of reference, which any trader can employ when day trading a particular market. They work best when used in combination with other technical and fundamental analysis tools.