

In the world of trading, employing effective indicators and tools is crucial to success. Two popular tools often used by traders are the Keltner Channel and Bollinger Bands. Both of these technical analysis indicators are designed to help traders identify potential trends, volatility, and entry/exit points.
It can also be used to identify reversals with the combination of other technical indicator.
In this article, we’ll compare the Keltner Channel and Bollinger Bands to determine which one might be better suited for various trading strategies.
Understanding the Keltner Channel
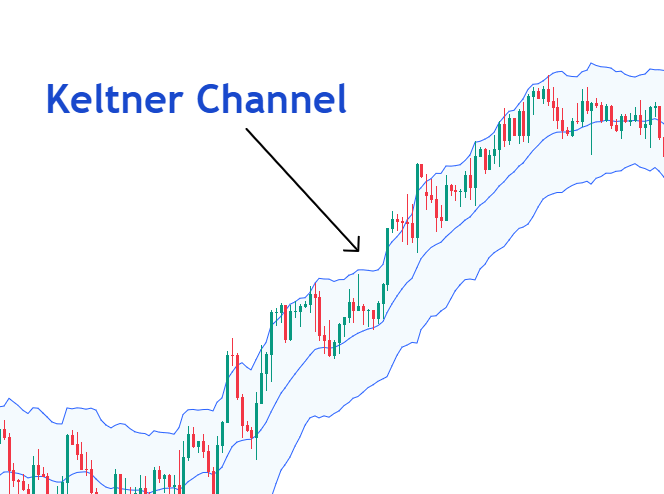
The Keltner Channel, developed by Chester W. Keltner, is a volatility-based indicator. It consists of three lines plotted around an exponential moving average (EMA). The middle line represents the EMA, while the upper line and lower line are typically drawn two times the average true range (ATR) away from the EMA.
The Keltner Channel aims to identify price movements by considering the average true range, which provides a measure of volatility.
How the Keltner Channel Works
To calculate the Keltner Channel, first, the average true range (ATR) is calculated based on a chosen period, usually 20 periods. Then, the middle line, which is the exponential moving average (EMA), is plotted.
The upper line and lower line are drawn at a distance from the EMA, which is determined by multiplying the ATR by a specified factor, often set to 2.
Pros of the Keltner Channel
- Effective in measuring volatility.
- Provides clear visual signals for potential breakouts.
- Can be used in conjunction with other indicators to confirm trends.
Cons of the Keltner Channel
- May generate false signals in choppy or sideways markets.
- Traders must adjust the ATR multiplier based on the specific market conditions.
Understanding Bollinger Bands
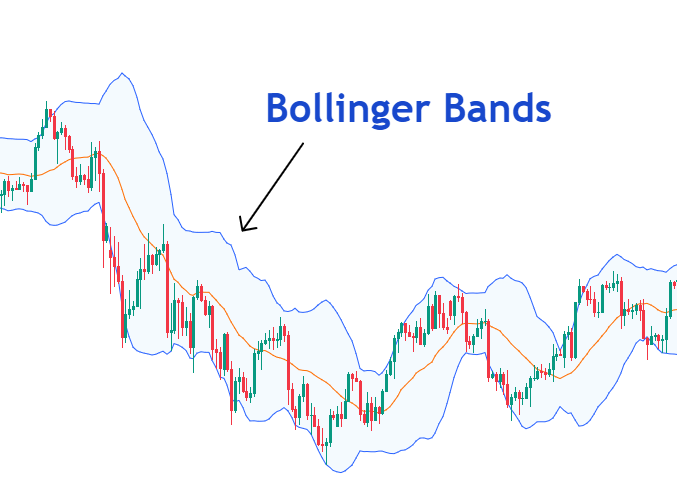
Bollinger Bands, created by John Bollinger, are another popular technical analysis tool widely used in the financial markets.
They consist of three lines: the middle band, which is a simple moving average (SMA), and two standard deviation bands, which are placed above and below the SMA. The standard deviation is a measure of a security’s price volatility.
How Bollinger Bands Work
Bollinger Bands adapt to market conditions. During periods of high volatility, the bands widen, and during low volatility, the bands contract. When the price moves close to the upper or lower bands, it indicates that the market might be overbought or oversold, respectively. The middle band can act as a support or resistance level.
Pros of Bollinger Bands
- Effective in identifying overbought and oversold conditions.
- Helps traders visualize market volatility.
- Can be combined with other indicators to confirm reversals.
Cons of Bollinger Bands
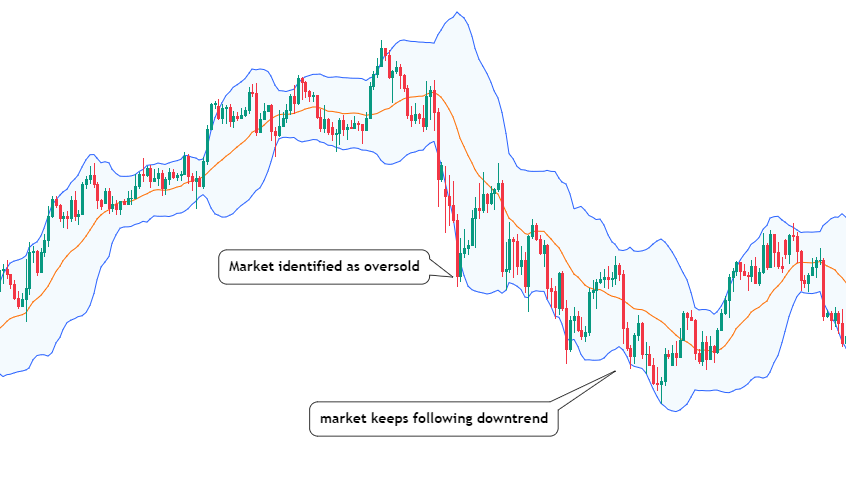
- In volatile markets, false signals can occur.
- The bands alone may not provide sufficient information for complex trading strategies.
Keltner Channel vs. Bollinger Bands: A Comparative Analysis
Both the Keltner Channel and Bollinger Bands aim to gauge market volatility and identify potential trading opportunities. However, they have distinct differences that make them suitable for various trading strategies.
Similarities between the Keltner Channel and Bollinger Bands
- Both use volatility as a key component of their calculation.
- They help traders identify potential breakouts and market reversals.
- They can be adjusted to suit different timeframes.
Differences between the Keltner Channel and Bollinger Bands
- The Keltner Channel uses the average true range (ATR) to measure volatility, while Bollinger Bands use standard deviation.
- The Keltner Channel has a middle line based on the exponential moving average (EMA), while Bollinger Bands use a simple moving average (SMA).
- Bollinger Bands adapt to market conditions by widening or contracting, while the Keltner Channel is more static.
Which Indicator to Choose: Keltner Channel or Bollinger Bands?
The choice between the Keltner Channel and Bollinger Bands ultimately depends on the trader’s trading style and the specific market conditions.
If a trader prefers a more dynamic indicator that adapts to changing market volatility, Bollinger Bands might be the preferred choice. On the other hand, if a trader is more interested in a straightforward volatility-based approach, the Keltner Channel could be a better fit.
It’s important to note that neither indicator is foolproof, and combining multiple indicators and trading strategies often leads to more robust decision-making. Using trend following indicators in combination with this indicator can be the best option.
Conclusion
In conclusion, both the Keltner Channel and Bollinger Bands are valuable tools for traders seeking to enhance their technical analysis. Each indicator has its strengths and weaknesses, and traders should thoroughly understand their functionality before incorporating them into their strategies.
One should keep an eye on the closing price of the candle, price action, price fluctuations, and other factors to trade effectively with these indicators in a channel direction.
By effectively using these indicators in conjunction with other tools, traders can improve their chances of making informed and timely trading decisions. As with any trading strategy, risk management and continuous learning are vital for long-term success.
FAQs
Q1: Can I use both the Keltner Channel and Bollinger Bands together?
Yes, many traders use a combination of both indicators to complement their analysis and gain more comprehensive insights into market conditions.
Q2: What is the recommended timeframe for using Bollinger Bands?
Bollinger Bands can be applied to various timeframes, from intraday to long-term charts. Choose a timeframe that aligns with your trading goals and risk tolerance.
Q3: Are there other volatility-based indicators worth considering?
Yes, some traders also use indicators like the Average True Range (ATR) and the Donchian Channel to assess market volatility. Also, make sure you keep an eye on price action too.
Q5: Where can I access these indicators on trading platforms?
Most trading platforms offer these indicators as built-in tools. You can find them in the indicator library or by searching for their specific names.


