

Moving averages are a go-to technical analysis tool in the trading world. While they generate credible entry signals in trending markets, they cause a lot of whipsaw trades during market consolidation, which is annoying because it leads to a string of minor profits and losses.
What if there was a moving average that could adapt to the market?
For decades, analysts have worked to enhance the simple moving average. Perry J. Kaufman came up with a type of moving average called the adaptive moving average (AMA) that smooths out price fluctuations to help recognize the market’s trends and trading opportunities. Its objective is to adjust to changing market conditions more quickly than other moving averages.
This trend-following indicator is widely used in technical analysis and is a foundational tool with a vast range of applications.
Below, we shall explore Kaufman’s adaptive moving average in detail as well as its applications in trading systems.
What is the Adaptive Moving Average?
Adaptive moving average (AMA) or Kaufman adaptive moving average (KAMA) is a type of moving average that dynamically modifies its sensitivity based on the volatility of the price movements. Traditional moving averages lag in capturing quick changes in price because they give equal weight to all data points over a certain period. Adaptive moving averages get around this restriction by adjusting their reactivity to market conditions, becoming increasingly adept at discerning between trending and ranging markets.
It seeks to filter out temporary, insignificant price movements or market noise. Additionally, it has better noise reduction and smoothing capabilities, giving traders a more accurate representation of patterns and trading signals.
The indicator adjusts to track prices less closely when price swings widen and more closely when price fluctuations are relatively small (reduced volatility or noise). The adaptive moving average essentially functions like a slow-moving average since it lessens the impact of outliers without sacrificing sensitivity.
Besides, this trend-following indicator is designed to take into account not only the recent price but the recent changes in market volatility as well, i.e. how much the price has been moving.
This is important because when volatility is low, it does not make large, erratic moves. It also makes it more likely that your trade may whipsaw out at a loss.
When volatility is low, the Kaufman Adaptive Moving Average, or KAMA, will remain nearer to the price action. It will lag further behind when volatility is high, and price movement is moving quickly, giving you information about the market’s direction (trending or flat).
Why is this so crucial for you as a trader? With its help, you can reduce the amount of noise that the regular moving average introduces and recognize instances in which the market has made a fast error or is not clearly in a trend.
Understanding the Adaptive Moving Average
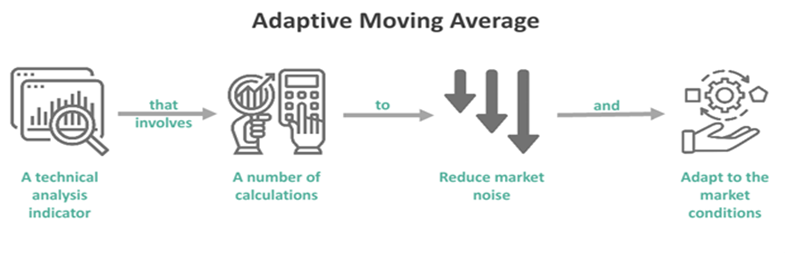
Adaptive moving average (KAMA) refers to a technical analysis tool that employs several calculations to adapt to changing market conditions and reduce noise. Its goal is to provide a more trustworthy and precise signal for identifying the trend’s direction and potential trading opportunities.
KAMA modifies its sensitivity to asset price changes based on market volatility, making it more receptive to abrupt shifts in price trends. Traders can apply this indicator in any market including forex, stocks, crypto, and futures.
The adaptive moving average uses adaptive smoothing to depict a more accurate representation of price trends. It operates by modifying its smoothing factor after considering the current market conditions. This will filter price movements and market noise, enabling traders to capture price decreases or increases more effectively.
The Kaufman adaptive moving average calculation combines price action and volatility to determine the best smoothing period. When compared to other moving averages, KAMA produces fewer false signals and is less vulnerable to whipsaw signs. This guarantees more reliable trading signals, helping traders to identify potential entry and exit opportunities with greater accuracy.
It is important to remember that the adaptive moving average obtains final values by using historical data.
The adaptive moving average is simple to use, and after being added to charts, traders can adjust its numerous parameters to fit their trading style and time frames.
The default periods for Kaufman’s adaptive moving average (KAMA) are 10, 2, and 30, however, it can be changed as per a trader’s preference.
Moreover, this indicator makes it possible to identify existing trends as well as any signs of a possible impending trend change. It can also help pinpoint trend reversal points, allowing traders to make exits and entries.
Formula
The formula for calculating Kaufman’s adaptive moving average (KAMA) is as follows:
Current KAMA = Previous KAMA + SC x (Current Price – Previous KAMA)
Where:
- The current Price is the security price for the last bar.
- The current KAMA is the KAMA value of the current bar.
- Previous KAMA is the KAMA value of the previous bar.
- SC stands for smoothing constant, which is adaptive and defined by the Efficiency Ratio.
Kaufman Adaptive Moving Average Calculation
As mentioned above, the adaptive moving average (KAMA) is calculated using several calculations, which are described in more detail below. The KAMA default settings:
- There must be a total of 10 periods for the ER, or Efficiency Ratio.
- The fastest EMA must have period 2.
- The slowest EMA must have period 30.
To determine the value of KAMA, the values of ER and SC must first be computed. So, let us examine their methods of calculation.
Step 1 – Calculating Efficiency Ratio (ER)
The efficiency ratio assesses the efficiency of price changes. It estimates the ratio of the absolute price change over a certain period to the total absolute difference between successive prices. The ratio typically swings between 1 and 0. The efficiency ratio is considered zero if the price stays constant for 10 periods. It is considered 1 if the price constantly rises or declines for 10 periods. However, it fluctuates between 0 and 1, when the price moves up or down for 10 consecutive periods.
The formula for calculating this efficiency index is:
Efficiency Ratio = Change / Volatility
Where:
Change = Absolute Value [(close – close(10 periods ago)]
Volatility = Sum of 10 periods Absolute Value(Close – Prior Close)
Step 2 – Calculating Smoothing Constant
The smoothing constant (SC) is calculated for each period, and its calculation involves the values obtained for the efficiency ratio and two further smoothing constants, namely ‘fast’ and ‘slow’.
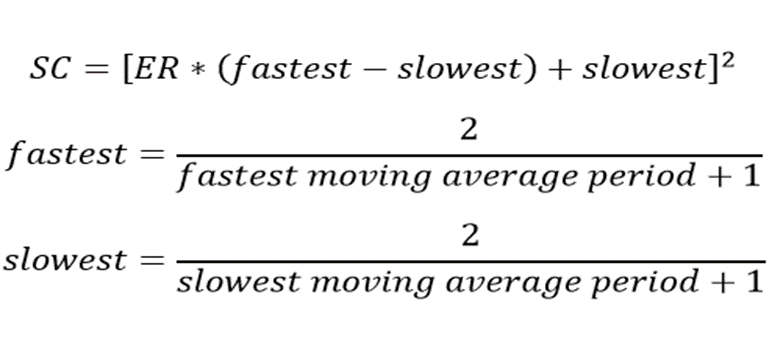
SC = [ER x (fastest SC – slowest SC) + slowest SC] ^ 2
The slowest SC for the 30-period exponential moving average is (2/30+1). In addition, the slowest 30-period exponential moving average uses the slowest smoothing constant as its SC. On the contrary, the smoothing constant for the shorter 2-period EMA has the fastest SC. The computation will change accordingly if the default values for the slow EMA and fast EMA are changed from 30 and 2, respectively.
Step 3- Calculating KAMA
Once you have completed calculating ER and SC, you can calculate KAMA using the above equation.
How to Use Kaufman’s Adaptive Moving Average in Trading Systems
The KAMA can be used in trading as other moving averages.
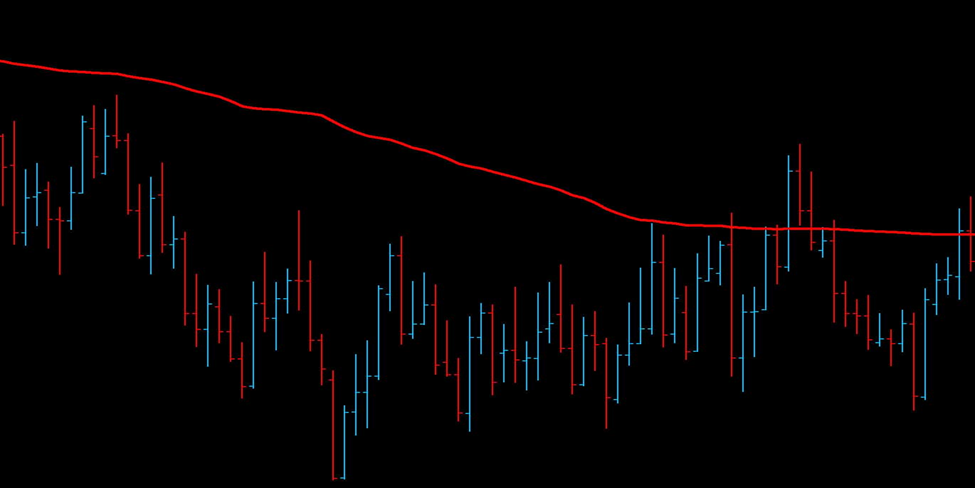
When the KAMA indicator line moves lower, particularly when the asset’s price is primarily below it, one must interpret this as a sign of a downward trend. However, a possible upward trend is indicated if the indicator line moves upward.
Now, let’s learn how to apply this indicator to trading.
-
Using Two Adaptive Moving Average Indicators
The indicator can be used to determine the trend reversal points and identify the market’s direction. This can be accomplished by plotting two of Kaufman’s adaptive moving average indicator lines on a chart. While one should have a faster-moving average (MA), the other must have a slower MA.
When the faster MA line crosses above the slower or long-term moving average, it indicates a change from a downtrend to an uptrend. In this situation, traders can enter a long position before they exit their trade when the faster or short-term moving average line crosses back below the long-term moving average line.
-
Making Use of The Price That Crosses the Indicator to Produce Signals
An asset has a buy or bullish signal when its price crosses the KAMA line from below. Similarly, individuals can receive a sell or bearish signal if the asset price declines below the KAMA line from above it.
-
Utilizing It with Price Action Analysis
The Kaufman adaptive moving average can be used to identify the direction of the market. The trade entry may then be decided using reversal candlesticks at the resistance and support levels.
Advantages & Disadvantages of Kaufman’s Adaptive Moving Average
Advantages
- Takes market volatility into account, which makes it more adaptable than traditional moving averages.
- May be applied to pinpoint overall trends, crossovers, and historical turning points.
- Contributes to signal accuracy by reducing market noise.
Disadvantages
- Some users may find complex calculations intimidating.
- Can still generate false signals, necessitating the use of additional filters to increase accuracy.
- Not appropriate for all types of trading; mainly focuses on trend-following strategies.
Conclusion
The adaptive moving average is an effective trading tool that can replace more conventional indicators. However, using it effectively calls for some expertise.
In comparison to other moving averages, this tool provides signals more quickly and generates fewer false signals, but this does not imply that AMA is error-free, and this should be taken into consideration. Not all trading terminals come equipped with Kaufman’s adaptive moving average indicator. It can be shown in a variety of ways on the chart to increase its effectiveness.
While it can be used alone for trading, it works best when combined with other indicators and oscillators, at which point it can replace the trader’s primary profitable approach.


