

Candlestick patterns are essential tools used in technical analysis to predict price movements in financial markets. Among the many candlestick patterns, the spinning top holds a unique position due to its indecisive nature.
In this article, we will delve into the intricacies of trading the spinning top candlestick pattern and explore various strategies to incorporate it into your trading arsenal effectively.
Understanding Candlestick Patterns
Before we dive into the specifics of the spinning top candlestick pattern, let’s have a brief overview of candlestick patterns in general.
Candlestick charts display price information within a specific time frame and provide valuable insights into the market sentiment. Each candlestick represents the price action during that period, consisting of four main components: the opening price, closing price, highest price (high), and lowest price (low).
What is a Spinning Top Candlestick Pattern?
A spinning top candlestick pattern is characterized by a small body and long upper and lower shadows, indicating a period of market indecision.
It occurs when the opening and closing prices are close to each other, resulting in a candlestick with a short body. The length of the shadows relative to the body can vary, and this pattern can be either bullish or bearish, depending on the overall market trend.
Anatomy of a Spinning Top Candlestick
To effectively trade the spinning top candlestick pattern, it is crucial to understand its key components. Here’s a breakdown of its anatomy:
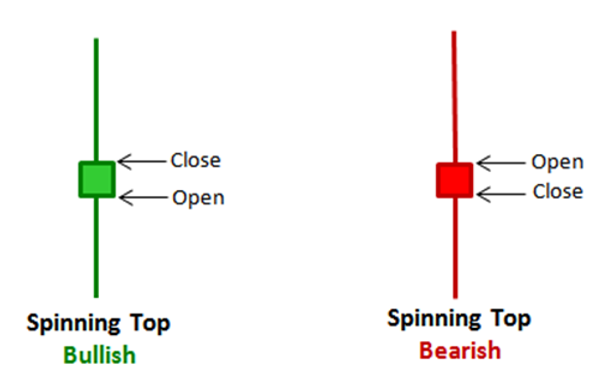
Upper and Lower Shadows: The upper shadow represents the highest price reached during the period, while the lower shadow represents the lowest price. The length of these shadows indicates the extent of price fluctuations within the time frame.
Body and Closing Price: The body of a spinning top candlestick is small, reflecting the narrow range between the opening and closing prices. The closing price is often used as a key reference point for interpreting the pattern.
Interpreting the Spinning Top Candlestick Pattern
The spinning top candlestick pattern can provide valuable insights into potential price reversals or trend continuation. Let’s explore its interpretations in both bullish and bearish scenarios.
Bullish Spinning Top Candlestick
In an uptrend, a bullish spinning top candlestick indicates a temporary pause or indecision among market participants. It suggests that buyers and sellers are continuously battling for control, resulting in a small price range.
While the spinning top alone may not provide a strong buy signal, it serves as a warning sign for traders to exercise caution and closely monitor the market.
Bearish Spinning Top Candlestick
On the other hand, a bearish spinning top candlestick in a downtrend signals a potential reversal or a continuation of the bearish trend.
It suggests that buyers attempted to push the price higher but were met with selling pressure, resulting in a small body and long upper shadow. Traders may interpret this as a sign of weakness in the downtrend, indicating a potential shift in momentum.
Using the Spinning Top Pattern in Combination with Other Indicators
While the spinning top candlestick pattern can provide valuable insights on its own, combining it with other technical indicators can further enhance its effectiveness.
By integrating additional tools, you can strengthen your trading decisions and increase the probability of successful trades.
One popular indicator that pairs well with the spinning top pattern is the Relative Strength Index (RSI). The RSI measures the strength and speed of price movements, indicating whether an asset is overbought or oversold.
When the spinning top candlestick pattern appears, and the RSI is in extreme overbought or oversold territory, it adds more weight to the potential reversal or continuation signal.
Another useful indicator to consider is the Moving Average (MA). By plotting a moving average line on your chart, you can identify the overall trend direction.
When the spinning top candlestick forms in alignment with the moving average, it strengthens the validity of the pattern and provides a higher probability trading opportunity.
Trading Strategies using the Spinning Top Candlestick Pattern
Now that we understand the interpretation of the spinning top candlestick pattern, let’s explore some trading strategies that can be applied to capitalize on its signals.
Reversal Trading Strategy
The spinning top candlestick pattern can be a precursor to a price reversal. To effectively use this pattern for reversal trading, consider the following steps:
1. Identifying Potential Reversal Signals: Look for spinning top candlesticks that appear after a prolonged trend, indicating potential exhaustion of the current trend.
2. Confirming with Other Candlestick Patterns: Validate the spinning top signal by looking for confirmation from other candlestick patterns, such as doji, engulfing patterns, or harami patterns.
3. Using Technical Indicators: Supplement your analysis with technical indicators like the Relative Strength Index (RSI) or Moving Averages (MA) to identify overbought or oversold conditions and confirm the potential reversal.
Breakout Trading Strategy
In addition to reversal trading, the spinning top candlestick pattern can also be used to identify potential breakout opportunities during periods of consolidation. Follow these steps for a breakout trading strategy:
- Identifying Sideways Movement: Look for spinning top candlesticks within a well-defined range, indicating a period of consolidation or indecision in the market.
- Placing Entry and Stop Loss Orders: When the price breaks above the high or below the low of the spinning top candlestick, initiate a trade in the corresponding direction. Place a stop loss order below the breakout level to manage risk.
Trend Following Strategy
Furthermore, the spinning top candlestick pattern can serve as a tool for trend following strategies. Here’s how you can incorporate it into your trend following approach:
1. Bullish Spinning Top in an Uptrend: When a bullish spinning top occurs in an established uptrend, consider it as a potential continuation signal. It suggests a brief pause or consolidation before the uptrend resumes.
2. Bearish Spinning Top in a Downtrend: If a bearish spinning top appears in a prevailing downtrend, it indicates a potential continuation of the downtrend. Traders can use this as an opportunity to enter or add to their short positions.
Risk Management and Stop Loss Placement
Regardless of the trading strategy employed, it is crucial to implement proper risk management techniques.
Determine your risk tolerance and set appropriate stop loss levels to protect your capital in case the market moves against your anticipated direction.
Consider the volatility of the instrument you are trading and adjust your position size accordingly.
Conclusion
The spinning top candlestick pattern is a valuable tool for traders seeking to identify potential reversals or continuation signals in the market.
By understanding its anatomy and applying various trading strategies, you can enhance your decision-making process and improve your trading outcomes.
Remember to combine the spinning top pattern with other technical analysis tools and indicators for confirmation and always practice proper risk management.
FAQs
- Can the Spinning Top Candlestick Pattern guarantee profitable trades?
While the spinning top pattern provides valuable insights into market sentiment, it does not guarantee profitability. It should be used in conjunction with other technical analysis tools and indicators for a more comprehensive trading approach.
- Are there any other candlestick patterns I should be aware of?
Yes, there are numerous other candlestick patterns that traders use for analysis, such as doji, hammer, engulfing patterns, and shooting stars, among others. It is beneficial to familiarize yourself with these patterns to enhance your trading skills.
- How do I determine the market trend when using this pattern?
To determine the market trend, you can utilize various tools and techniques such as trend lines, moving averages, or other trend-following indicators. These will help you identify the overall direction of the market and align your trading decisions with the prevailing trend.
- Should I rely solely on candlestick patterns for trading decisions?
Candlestick patterns are powerful tools, but it is recommended to combine them with other forms of technical analysis, such as support and resistance levels, trendlines, and indicators. By using a holistic approach, you can gain a more comprehensive view of the market and make more informed trading decisions.
- Can I use the Spinning Top pattern for day trading?
Yes, the spinning top pattern can be applied to day trading strategies. Traders can use it to identify potential reversals or breakouts within shorter time frames. However, it is crucial to consider the overall market context and use additional indicators to increase the probability of successful trades.


