
The Triple Screen Trading System was developed by Dr. Alexander Elder, a psychiatrist in New York who later got involved in financial trading and became a world-famous trader. The trading system was originally featured in a Futures Magazine article in 1986. Dr. Elder’s most popular book, “Trading for a Living” describes it in detail.
The Triple Screen Trading Strategy monitors price movement using multiple screens, each depicting a different time frame. It combines trend-following indicators and oscillators, filtering out their disadvantages and preserving their advantages. This is helpful in financial markets that are challenging and complex to navigate, with multiple indicators frequently producing contradictory trading signals. The use of more than one screen helps in avoiding conflict among indicators.
The Triple Screen Trading System puts each potential trade through three tests. Trades that pass all three standards should offer more profit opportunities than those that fail one or more tests. So, how does this strategy operate in detail? Let us take a look!
What is the Triple Screen Trading System?
Dr. Alexander Elder invented the Triple Screen Trading System, which filters out contradicting trading signals using various indicators. The method is founded on the notion that no single indicator can properly assess the complexity of financial markets and that different indicators can give conflicting indications for the same market.
The triple-screen method involves subjecting every possible trade to three screens or tests, which are a mix of trend-following indicators and oscillators. A trade setup, which passes all three screens holds the best opportunity to become a success.
The screens are applied to three separate timeframes: a higher timeframe, which provides a greater overview of the market, a middle timeframe, which confirms the analysis, and a lower timeframe, which gives an in-depth assessment of the present scenario and allows you to choose a precise entry point.
How does the Triple Screen Trading Work?
Elder’s Triple Screen system involves finding and choosing trades according to three criteria i.e. three screens of the approach. Each screen displays the price chart of a single instrument over a specific timeframe, along with other indicator signals. The screens are examined in order of increasing timeframe.
There are three trend lengths for each screen.
- The long-term trend correlates to the first screen; we will be looking for an entry point in that direction. The timeframe can be a month or less, depending on your trading preferences,
- The mid-term trend aligns with the second screen; it is 3-6 times shorter than the long-term trend. This is your primary working timeframe during which we will look for a trade entry signal.
- The short-term trend is displayed on the third screen. This timeframe is 3-6 times shorter than the intermediate one and assists in finding an appropriate entry point.
You must select a preferred timeframe – this will serve as your mid-term trend (the second screen). The long-term trend is going to be 3-6 times longer, while the short-term trend will be 3-6 times shorter.
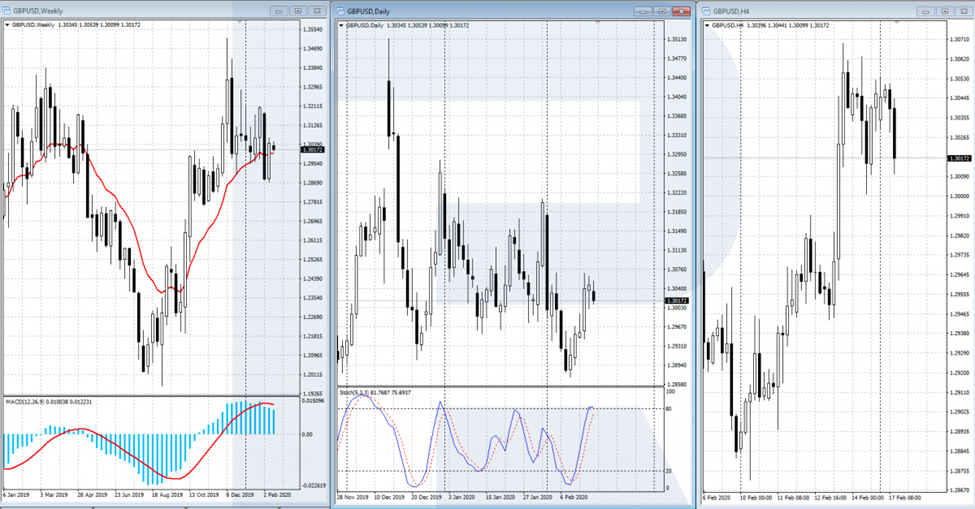
A daily timeframe could serve as your second screen if your trades typically last several days or weeks. After that, for the first screen, you can choose a weekly timeframe, and for the third, an hourly or 4-hour timeframe will suffice. Intraday traders can perform the same thing with shorter timeframes. For instance, if the intermediate trend is H1 or H4, the long-term trend is D1, and the short-term trend is M15 or M5.
In a nutshell, the Triple Screen strategy is a filter for identifying trades along with the dominant trend following a correction, which are the classics of technical analysis. We identify a long-term trend on the first screen, then an intermediate trend following a correction, and finally an entry point on the third screen (the smallest timeframe). We will go over each screen in greater detail below.
The Market Trends
According to researchers who study price market data over time, there are three sorts of market trends: long-term trends in years, middle-term trends in months, and short-term trends in less than a month. A technical analyst named Robert Rhea refers to these three trends as “tides” to the long term, “waves” to the mid-term, and “ripples” to the short term.
Trading by long-term tides was considered one of the greatest ways in the previous era. Short-term ripples were rarely identified, therefore if a trader wanted to enter and exit the market, he should look for middle-term waves.
However, as the number of traders in the world has grown, the market has gotten increasingly complex. Many traders nowadays follow the intermediate and short-term using various time frames.
Setting Up Triple Screen Trading System
As mentioned above, the Triple Screen System involves the application of three screens to every trade:
First Screen
Long-term tides are critical in making trading decisions. First, examine the long-term time frame, which is a step higher than the intermediate time frame. The longest time frame of all three is the first screen of the Triple Screen System. A monthly or weekly chart will be a perfect pick for investors, and a smaller scale like W1, D1, or H4 will be suitable for traders. Alexander Elder compares the long-term trend with the main trend (intermediate time frame) that is normally chosen to begin a trade.
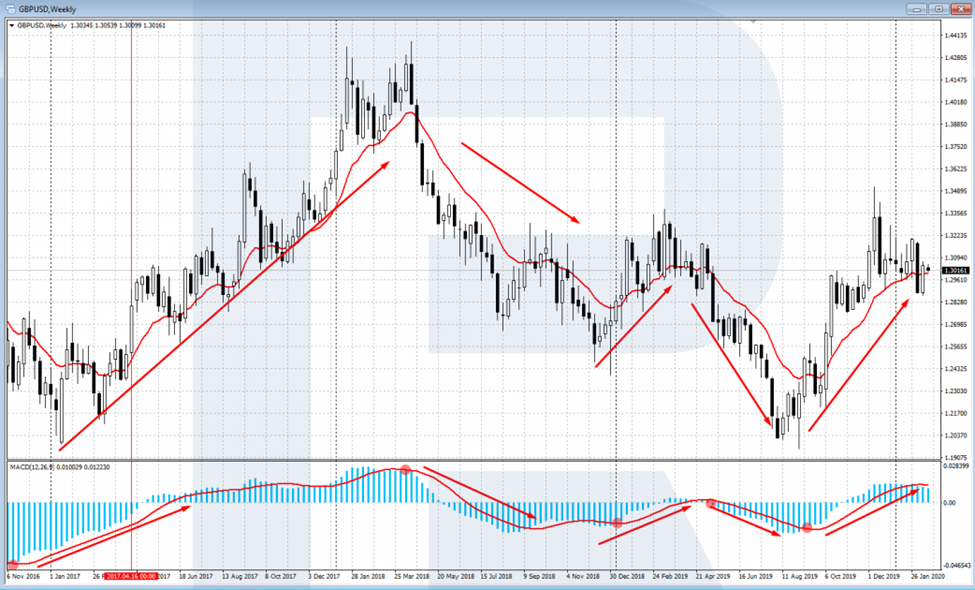
We identify the trend using traditional technical analysis methods and extra indications from trend indicators. Alexander Elder suggests using the EMA (Exponential Moving Average) with period 13 of the typical MACD (12,26,9) to determine trend direction. The MACD histogram’s upward or downward movement indicates the current trend’s direction.
We can speak about a long-term upward trend if the MACD histogram has flipped and is going upwards from the region below 0. If the MACD histogram has flipped and is going downhill from the region above zero, the market is in a long-term decline. Similarly, if the EMA (13) is rising, the trend is increasing; if it is falling, the trend is dropping.
Second Screen
After identifying the direction of the trend on the first screen, the role of the second screen comes into play. On this screen, we’ll see a chart with a smaller time frame, on which we’ll look for a trend that runs in the opposite direction to the long-term tide and wait for it to reverse.
Alexander Elder proposes basic oscillators such as Stochastic, RSI (Relative Strength Index), and Williams Percentage Range to indicate the moment of reversal of the intermediate trend in the direction of the long-term trend. When the oscillator hits the overbought/oversold zone, an entry indication in the direction of the tide (long-term trend) will appear. A divergence of the oscillator and price chart can also be used.
Four oscillator indicators normally applied to the Triple Screen Trading Strategy are as follows:
Force Index
Dr. Alexander Elder created the indicator to measure the bullish and bearish power of the Moving Average. The Exponential Moving Average (EMA) parameter for the Triple Screen Strategy is set to 2-period. According to Elder, the 2-period EMA in the Force Index is well suited for use in conjunction with trend indicators like MACD.
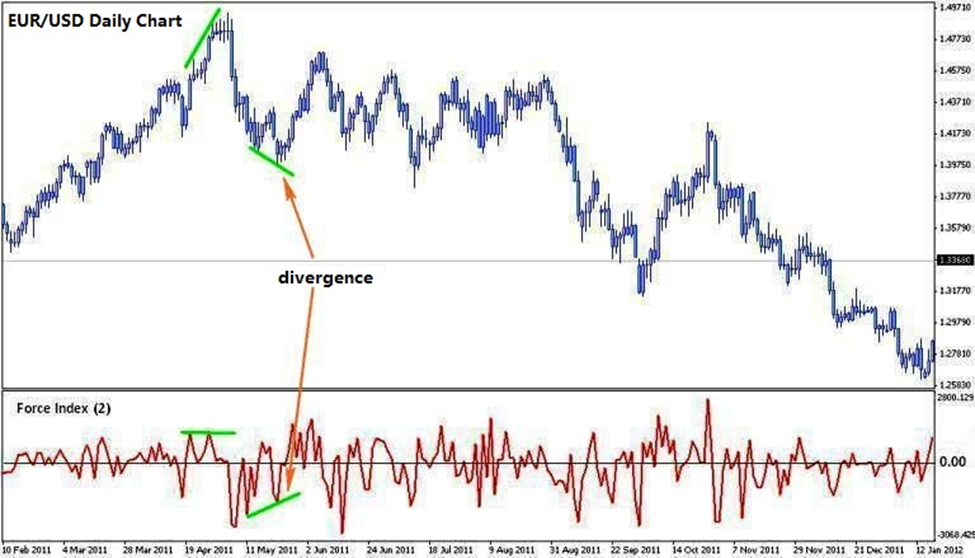
If the 2-period EMA line in the Force Index is greater than 0, the bullish emotion is stronger. However, if it is less than 0, the bearish emotion is stronger.
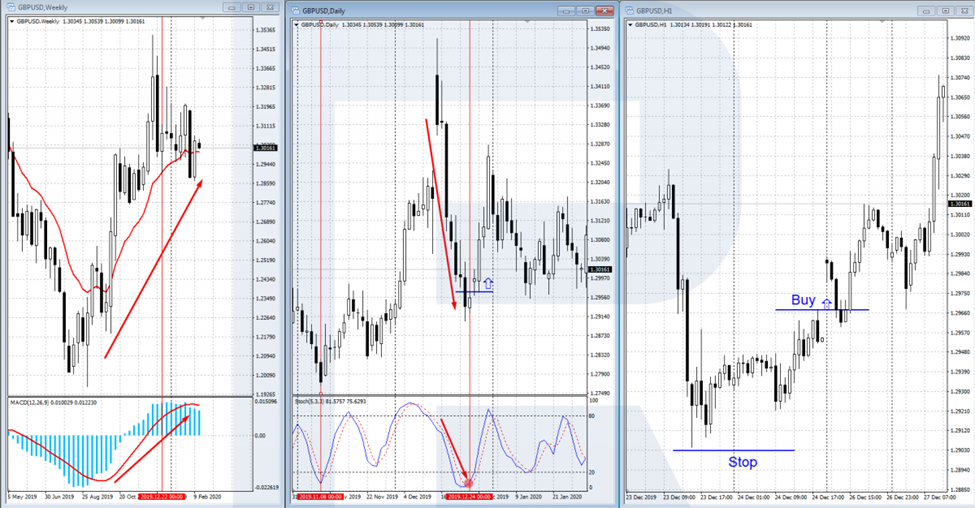
Suppose the indicator is employed for the dominant time frame of the triple screen trading system (1-day time frame), and the MACD histogram forms a slope to the top or bullish at the weekly time frame. In that case, you can decide to open a buy trade when the Force Index Indicator is in a negative region with an upward pullback momentum.
The buy position must be opened higher than that day’s highest level. You can utilize a stop order (buying stop) to wait for confirmation in this instance. The stop loss can be set at the lowest level of the day or the previous day, depending on which one has the lowest price.
Your buy order will be completed if the trend direction is verified. However, your position won’t be completed if the signal isn’t confirmed and the price doesn’t activate the buy-stop order.
The exit level may be selected manually when the long-term trend (weekly) has gone in the other direction. It can also be established manually when there is a bearish divergence in the primary time frame (daily). The indicator indicates that the forthcoming trend is moving from bullish to bearish.
Elder Ray Index
Elder Ray Index is another oscillator that can be deployed on the second screen. Dr. Alexander Elder developed the indicator based on the market’s bullish and bearish power. The bullish power evaluates the market’s capacity to drive the price above the current average range, while the bearish power evaluates its capacity to push the price below the current average range.
Long-term trend direction can be identified by employing a trend indicator like the MACD in the long-term time frame. The Elder Ray indicator is utilized to determine the best time to enter the market.
If the price action on the weekly time frame is bullish or forming an upward trend, you should focus on the buy alert on the daily time frame (according to the trading rules of the Triple Screen Strategy). If the long-term trend is bearish, you may wait for a sell signal in the primary time frame.
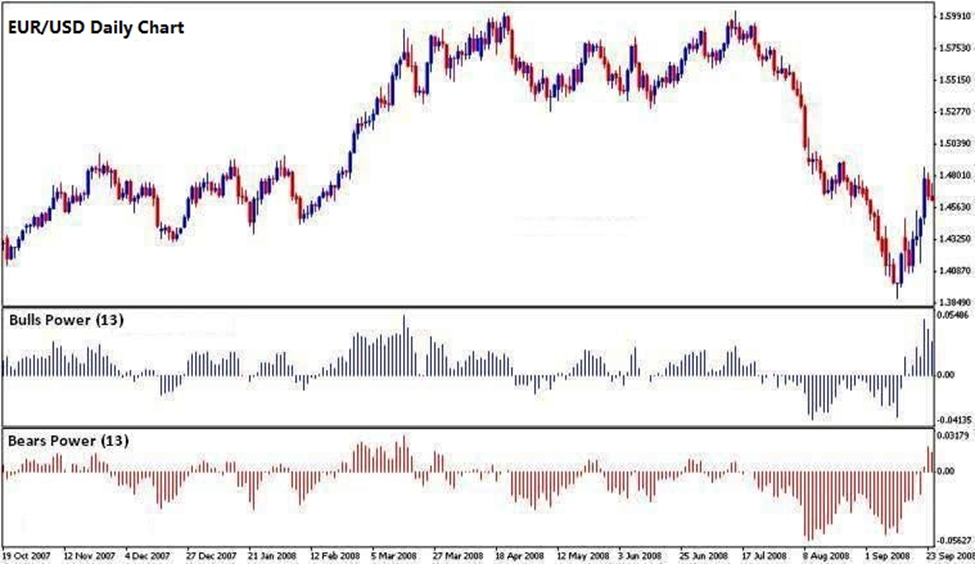
It’s a preferred time to buy when the long-term time frame’s price action is bullish, and the Bears Power is in the negative zone (under the 0 mark), but the direction starts to climb up. If the weekly timeframe is bullish, you should consider the Elder Ray indication in the intermediate time frame (1 day).
Stochastic
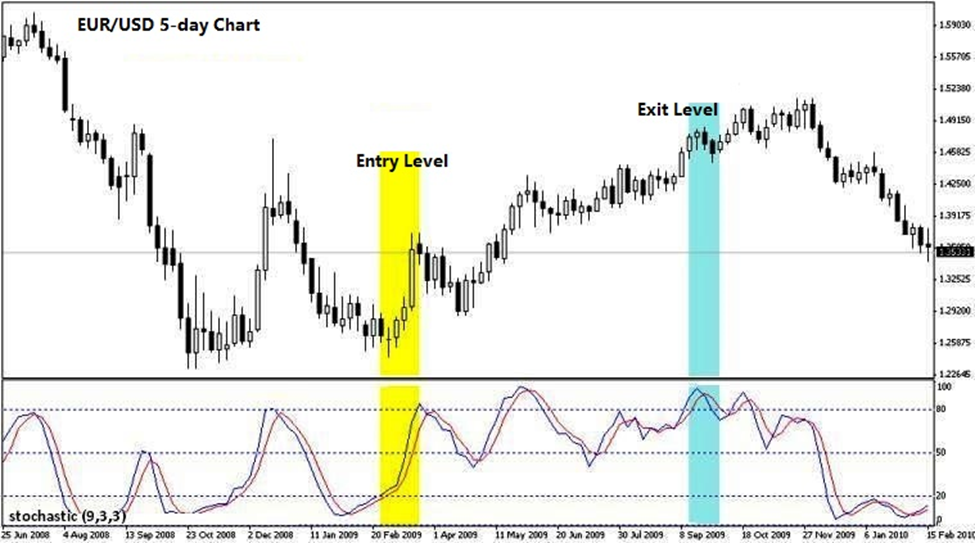
Apart from the Force Index and the Elder Ray, Stochastic is an excellent oscillator for the Triple Screen Trading Strategy. The indicator is widely used by forex traders and is thought to be effective at filtering out noise or useless data.
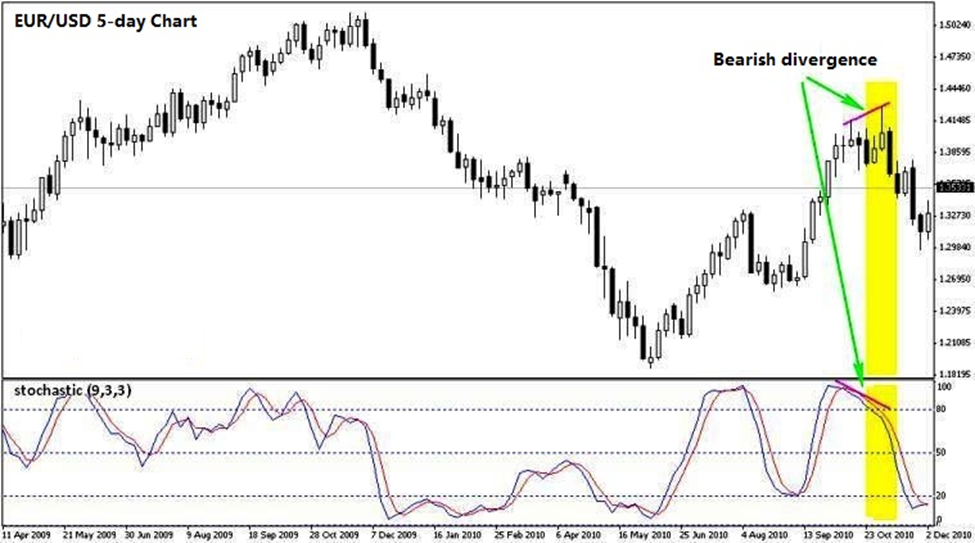
Observing the divergence, using the Stochastic lines crossing, and finding the overbought and oversold levels are three approaches to using Stochastic. The setup’s default parameter is [14, 3, 3] or [9, 3, 3].
Here are two instances of Stochastic implementations [9, 3, 3] on the 2nd screen for a daily EUR/USD chart:
Williams Percentage Range
Williams Percent Range is frequently abbreviated as Williams%R or simply %R. Larry Williams, a known commodity trader who also works in the stock and forex markets, created the indicator. Williams%R was released in 1973 and is listed as an oscillator due to its signal value, which swings between 0 and -100.
It is frequently compared with Stochastic due to similarities. If the Stochastic ranges from 0 to +100, the %R ranges from 0 to -100. However, unlike Stochastic, the %R doesn’t employ a smoothing factor.
The Williams%R depicts the relationship between the closing price and the price range (from highest to lowest price) in a certain interval. The capacity to identify price trend reversals is the most well-known aspect of this indicator.
Third Screen
The 3rd screen displays the short-term time frame. According to the Alexander Elder trading strategy, the third screen is used to place trading positions, either buy or sell orders, based on the analysis of the 1st and 2nd screens.
Trailing Stop Orders are employed in this approach, with the buy stop order being used when the market is in an uptrend and the sell stop order being used when the market is in a downtrend.
If the first screen has an uptrend and the second has a downtrend, the Trailing Stop will capture a buy at an upward reversal. The Buy Stop order is set one point above the previous period’s high where we received the buy signal from the oscillator. If the price continues to fall, the order likewise falls, briefly above the high, until a buy opens or the primary trend reverses – at which time the trade is canceled. If the order was executed, the stop loss is set to the two-day low.
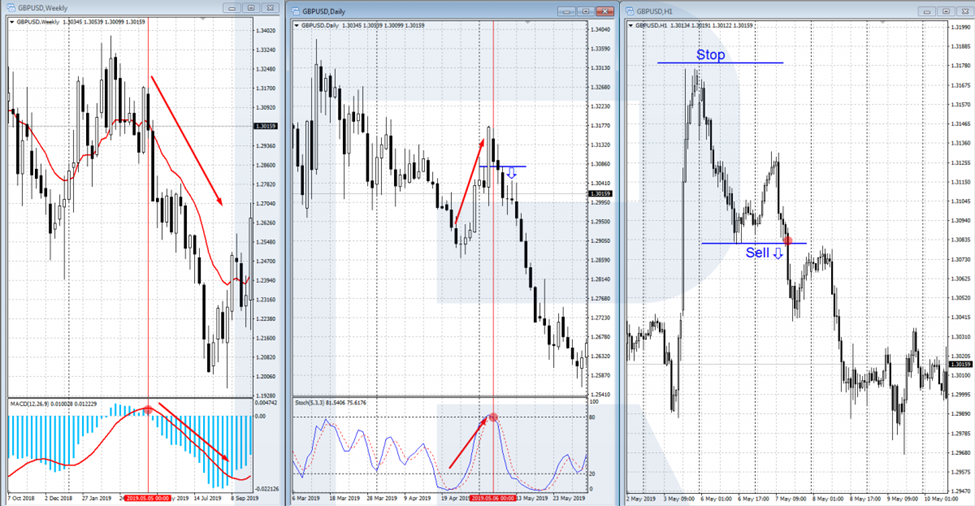
If the long-term trend is declining and the mid-term trend is increasing, Trailing Stop orders will catch sales as the price moves downward. The Sell Stop order is set one point below the previous day’s low, where the oscillator indicates to sell. If the price rises, the order will be moved one point below the low, and so on, until a sale occurs or the long-term trend reverses, negating the signal. If the transaction is open, the stop loss is set behind the two-day high.
Conclusion
In conclusion, the Triple Screen Trading System is an effective and versatile approach to trading that can assist traders in making informed decisions by offering a detailed view of the market. It has become immensely popular due to its applicability in various financial markets and its ability to provide reliable signals. The Alexander Elder trading strategy provides an overall view of an instrument, allowing the trader to examine the instrument’s behavior on several time frames and discover an entry along with the dominant trend.