Candlestick patterns have been a cornerstone of technical analysis in trading for centuries. These visual representations of price movements provide valuable insights into market sentiment and can help traders make informed decisions.
By understanding and recognizing the most reliable candlestick patterns, traders can gain an edge in the market and unlock trading success.
This article will delve into various candlestick patterns, their significance, and how they can be effectively used in trading strategies.
Understanding Candlestick Patterns
Candlestick charts are graphical representations of price movements over a given time period. Each candlestick consists of four key components: the opening price, closing price, high price, and low price.
The body of the candlestick represents the price range between the opening and closing prices, while the wicks or shadows indicate the high and low prices reached during the session.
Candlesticks can be either bullish or bearish, depending on whether the closing price is higher or lower than the opening price.
Bullish Reversal Candlestick Patterns
Bullish reversal patterns are candlestick formations that indicate a potential trend reversal from bearish to bullish. These patterns often appear after a downtrend and suggest a shift in market sentiment.
Hammer Candlestick pattern
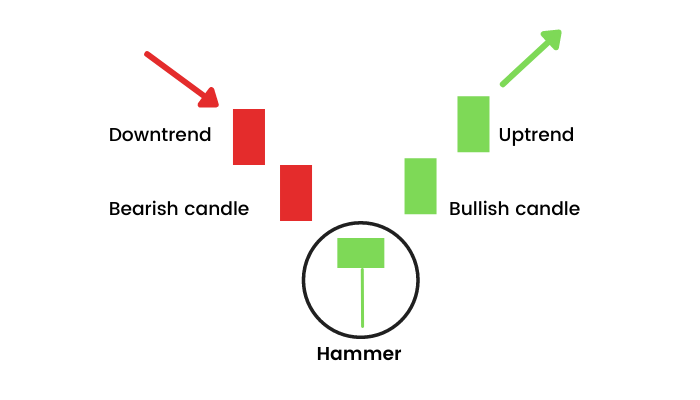
One such pattern is the hammer candlestick pattern, characterized by a small body and a long lower wick. It signifies that buyers have entered the market and are pushing prices higher.
Morning star Candlestick pattern
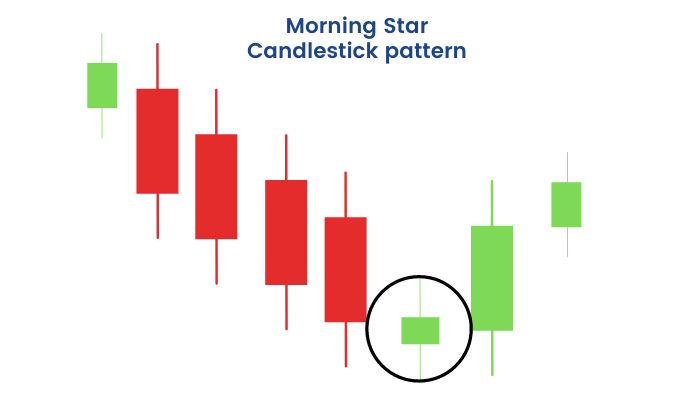
Another bullish reversal pattern is the morning star candlestick pattern. It consists of three candles: a large bearish candle, a small-bodied candle (can be bullish or bearish) that gaps down, and a large bullish candle that engulfs the previous two candles. The morning star pattern indicates strong buying pressure and a potential trend reversal.
Bullish Engulfing pattern
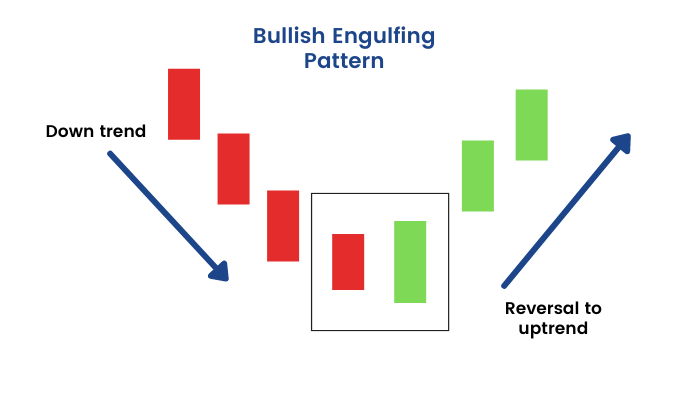
The bullish engulfing pattern is yet another reliable bullish reversal pattern. It occurs when a small bearish candle is followed by a larger bullish candle that engulfs the body of the previous candle. This pattern suggests a shift in momentum from sellers to buyers.
Bearish Reversal Candlestick Patterns
On the other hand, bearish reversal candlestick patterns indicate a potential trend reversal from bullish to bearish. These patterns often occur after an uptrend and signal a shift in market sentiment.
Bearish harami
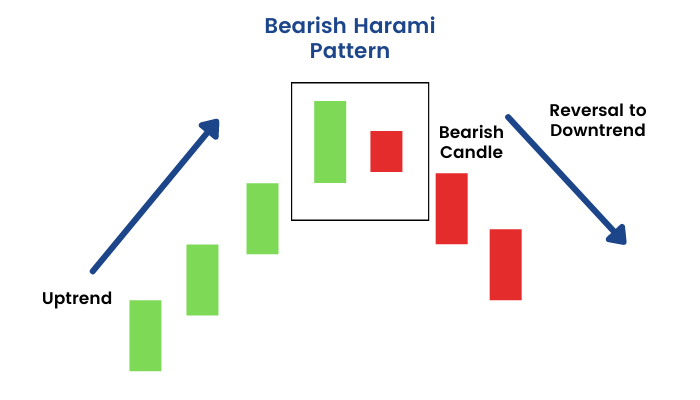
One commonly observed bearish reversal pattern is the bearish harami candlestick pattern. It consists of a large bullish candle followed by a small-bodied candle (bullish or bearish) that is completely engulfed by the body of the previous candle. The bearish harami pattern suggests a weakening of buying pressure and a possible trend reversal.
Evening star
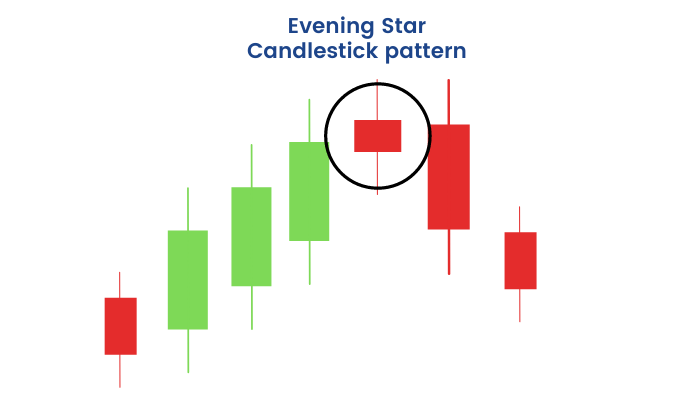
Another significant bearish reversal pattern is the evening star candlestick pattern. Similar to the morning star pattern, it comprises three candles. The first candle is a large bullish candle, followed by a small-bodied candle (bullish or bearish) that gaps up.
Finally, a large bearish candle engulfs the previous two candles. The evening star pattern indicates a shift in momentum from buyers to sellers.
Bearish engulfing pattern
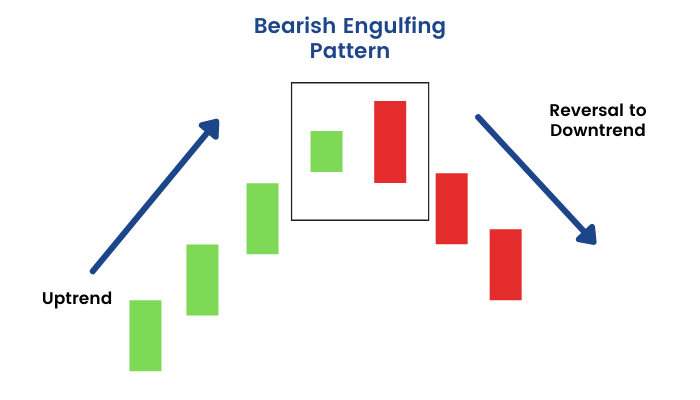
Additionally, this pattern is a reliable bearish reversal signal. It occurs when a small bullish candle is followed by a larger bearish candle that engulfs the body of the previous candle. This pattern suggests a transition from buyer dominance to seller dominance.
What is a single candlestick pattern?
A pattern that is generated by just a single candle is termed a single candlestick pattern. Typically, traders use the 1-day candlestick chart to identify a single candlestick pattern. This is one of the simplest forms of technical analysis and takes very little time.
Now that you’ve been introduced to single candlestick patterns, let’s take a look at some important patterns that you need to know about.
1. Doji
Considered to be one of the most important single candlestick patterns, the doji can give you an insight into the market sentiment. Dojis are said to be formed when the opening price and the closing price of a stock are the same. Since the opening price equals the closing price, these candlesticks actually have no body. Here’s an example of a doji.
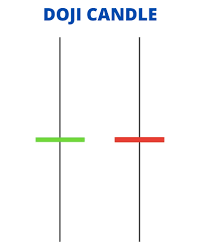
As you can see, the upper and lower shadows are quite long here, which signifies an increase in volatility. But, despite the volatile behavior, the stock has opened and closed at the same price. This essentially indicates that there’s indecisiveness in the market.
When a doji appears during either a bullish or a bearish trend, it indicates a pause in the trend and that the market players (buyers and sellers) are uncertain about the price movement.
This signal can be construed as a possible impending reversal of the trend.
2. Dragonfly doji
The dragonfly doji is formed when the opening and closing prices of a stock are at the highest point of the day. The dragonfly doji has no upper shadow and a long lower shadow. The candlestick pattern looks like this.
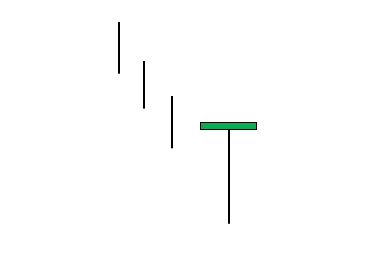
The dragonfly doji signifies a bullish trend with buyers having a strong grip on the price movement.
3. Gravestone doji
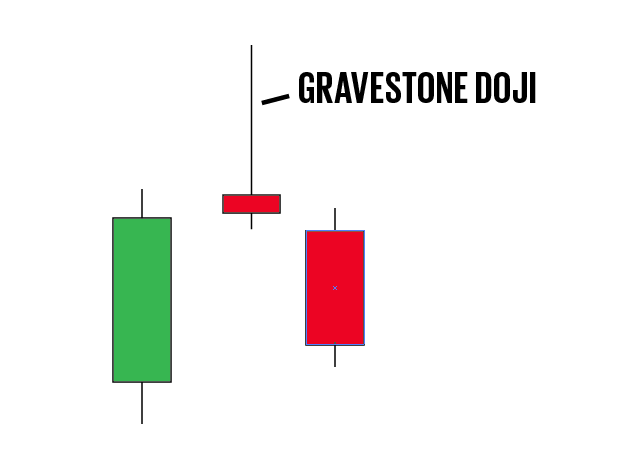
It is the direct opposite of the dragonfly doji. The gravestone doji is formed when the opening and closing prices of a stock are at the lowest point of the day. The pattern has no lower shadow and a long upper shadow.
This pattern is a classic indicator of a bearish trend with the sellers holding a strong grip over the price movement. The gravestone can be construed as a reversal signal when it appears during a bullish trend.
4. Spinning top
Similar to the doji, the spinning top is another single candlestick pattern that signifies indecisiveness and uncertainty in the market. A spinning top is formed when the closing price is near the vicinity of the opening price.
The long shadows mean that both the buyers and the sellers are fighting for control, but neither of them has been able to get the upper hand. Hence, the uncertainty in the price movement.
5. Hammer
The hammer is a single candlestick pattern that appears with a short body on the upper end of a candle and with a long lower shadow. The pattern is still considered to be a hammer if the candle has a short upper shadow. Here’s what the pattern looks like.

According to most traders, for a candle to be classified as a hammer, the lower shadow of the pattern is required to be at least two times longer than that of the candle’s body.
The longer the lower shadow is, the more the bulls are in control. Another point to note is that the hammer can either be green (where the closing price is higher than the opening price) or red (where the closing price is lower than the opening price).
Using Candlestick Patterns in Trading
Incorporating candlestick patterns into a trading strategy requires a comprehensive understanding of market dynamics and proper risk management.
Traders should consider factors such as the overall market direction, the strength of the candlestick pattern, and confirmation from other technical indicators or chart patterns.
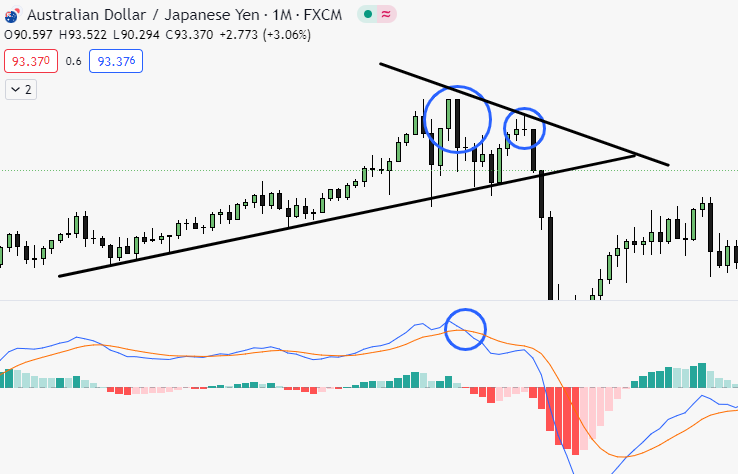
While candlestick patterns provide valuable insights, they are most effective when used in conjunction with other tools and techniques of technical analysis.
Traders may consider combining candlestick patterns with trend lines, moving averages, or oscillators to increase the accuracy of their trading signals.
Common Mistakes to Avoid
When using candlestick patterns, traders must be cautious of common pitfalls that can lead to poor decision-making. One common mistake is an overreliance on single candlestick patterns.
It is crucial to analyze candlestick patterns in the context of the overall market environment, taking into account the prevailing trend and other supporting indicators.
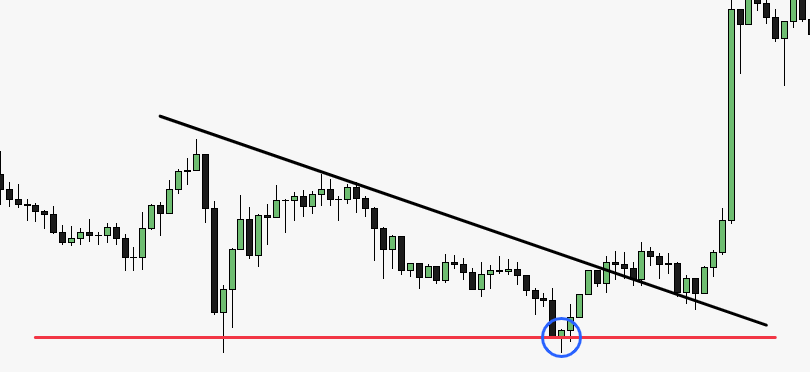
Another mistake to avoid is ignoring market context and trends. Candlestick patterns should not be viewed in isolation but rather about the broader market conditions.
For instance, a bullish reversal pattern may carry more weight in an upward-trending market compared to a sideways or bearish market.
Conclusion
Candlestick patterns are powerful tools for traders to interpret market sentiment and make informed trading decisions. By mastering the most reliable candlestick patterns, traders can unlock trading success and gain a competitive edge.
However, it is essential to remember that candlestick patterns are not infallible and should be used in conjunction with other technical analysis tools. Traders should wait for the candle formation.
Developing a comprehensive trading strategy that incorporates candlestick patterns can enhance the probability of successful trades.
FAQs
1. What are the most reliable candlestick patterns?
The most reliable candlestick patterns include the hammer, morning star, bullish engulfing, bearish harami, evening star, bearish engulfing, and dark cloud cover patterns.
These patterns have proven to be effective in signaling potential trend reversals and continuation patterns.
2. How do candlestick patterns help in identifying trend reversals?
Candlestick patterns help in identifying trend reversals by providing visual cues of shifts in market sentiment.
Bullish reversal patterns indicate a potential change from a downtrend to an uptrend, while bearish reversal patterns suggest a potential shift from an uptrend to a downtrend.
Traders analyze the formation and characteristics of candlestick patterns to anticipate trend reversals and adjust their trading strategies accordingly.
3. Can candlestick patterns be used in conjunction with other trading tools?
Yes, candlestick patterns can be used in conjunction with other trading tools and indicators to increase the accuracy of trading signals.
Traders often combine candlestick patterns with trend lines, moving averages, oscillators, or other chart patterns to validate their analysis and make more informed trading decisions.
By confirming candlestick patterns with additional indicators, traders can enhance their understanding of market dynamics and improve the effectiveness of their trading strategies.
4. Are candlestick patterns equally effective in all market conditions?
Candlestick patterns can provide valuable insights into various market conditions, including trending markets, consolidating markets, or even during periods of high volatility.
However, the effectiveness of candlestick patterns may vary depending on the prevailing market conditions.
For example, reversal patterns tend to be more reliable when they occur at key support or resistance levels, while continuation patterns may be more meaningful during a trending market.
Traders need to consider the overall market context when interpreting candlestick patterns and adapting their trading strategies accordingly.
5. What is the significance of the opening and closing prices in candlestick patterns?
The opening and closing prices in candlestick patterns hold significant information about market sentiment and the balance between buyers and sellers. The relationship between the opening and closing prices determines the color and size of the candlestick’s body.
A bullish (upward) candlestick has a closing price higher than the opening price, indicating buying pressure and a potential price increase. Conversely, a bearish (downward) candlestick has a closing price lower than the opening price, suggesting selling pressure and a potential price decrease.
The opening and closing prices also play a role in determining the size of the candlestick’s body. A large body indicates a substantial price movement during the trading session, while a small body suggests a relatively smaller price range.
By analyzing the relationship between the opening and closing prices, traders can gauge the strength of market sentiment and make more informed trading decisions.
In conclusion, mastering candlestick patterns is essential for traders looking to unlock trading success. These visual representations of price movements provide valuable insights into market sentiment and can be used to identify potential trend reversals and continuation patterns.
By incorporating candlestick patterns into a comprehensive trading strategy and considering other technical indicators, traders can enhance their ability to make well-informed trading decisions.
Remember to adapt your approach based on market conditions and always practice proper risk management.


