

Making sense of price variations throughout the day is frequently a difficult mental exercise for a new trader. We can boost our profits by finding specific price patterns with a higher-than-average possibility of success. One of the most reliable ways to do this is using candlestick patterns. The Japanese adopted them in the 1700s to summarize rice trading activities and price changes.
Price action traders who take the time to study and identify patterns as they develop find this kind of technical analysis essential when attempting to read the market and forecast where prices will go. It provides them with a very efficient and insightful review of the given day’s trading activity.
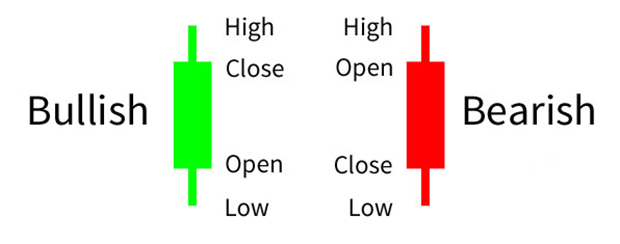
A candlestick pattern highlights the day’s price activity by displaying the opening and closing prices, the day’s high and low, and if the currency pair closed lower or higher than it opened.
These price points result in rectangles of varying heights with vertical line extensions on the top and/or bottom, indicating a high and/or low that differs from the open and close trading prices. The color indicates whether the pair closed lower or higher on that day.
When candlesticks occurring on multiple days are examined, predictive indicators in the shape of well-known patterns emerge, which traders should be aware of.
What is an Outside Bar Candlestick Pattern?
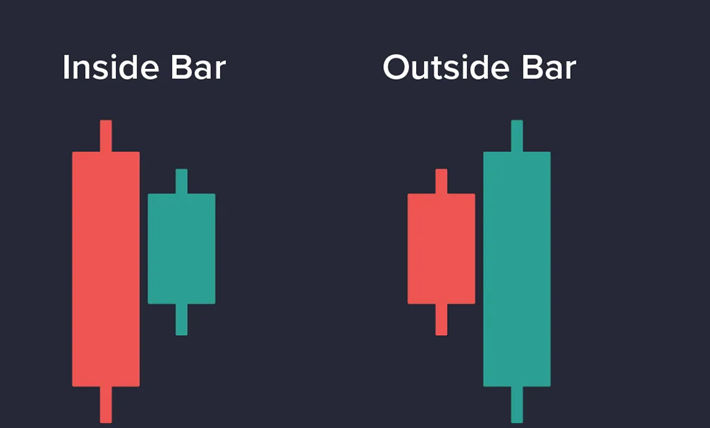
An outside bar pattern, like all other candlestick patterns, is a price action indicator that predicts price trends in the forex market. It consists of two candlesticks. The pattern is formed when the high and low of one candle completely engulf the high and low of the previous candle, resulting in a bigger candlestick with a distinct body and wicks. This somewhat looks like an engulfing pattern. The candlestick is larger because the price activity range was more than that of the session(s) with which it is being compared, thus raising the height measurement of the candlestick rectangle.
An outside bar indicates a potential shift in market sentiment, which could result in a trend reversal or continuation of the prevailing trend.
Traders utilize the outside bar trading strategy to identify market reversals based solely on price action. It is conceptually identical to the inside bar method, but the configuration is reversed. In an inside bar pattern, the high and low range of a candlestick is inside the high and low range of the previous candle, whereas in an outside bar pattern, the ‘outside bar’ entirely engulfs or overshadows the previous bar.
I’ve been using the outside bar pattern for more than a decade in a variety of markets, including forex, equities indexes, metals, and cryptocurrency. It is simple to identify on a price chart, and the rules are simple, making it an easy pattern to trade. But more significantly, it’s consistent and profitable, so keep reading if you want to enhance your trading skills by better comprehending price action.
Bullish Outside Bar and Bearish Outside Bar Candlestick Patterns
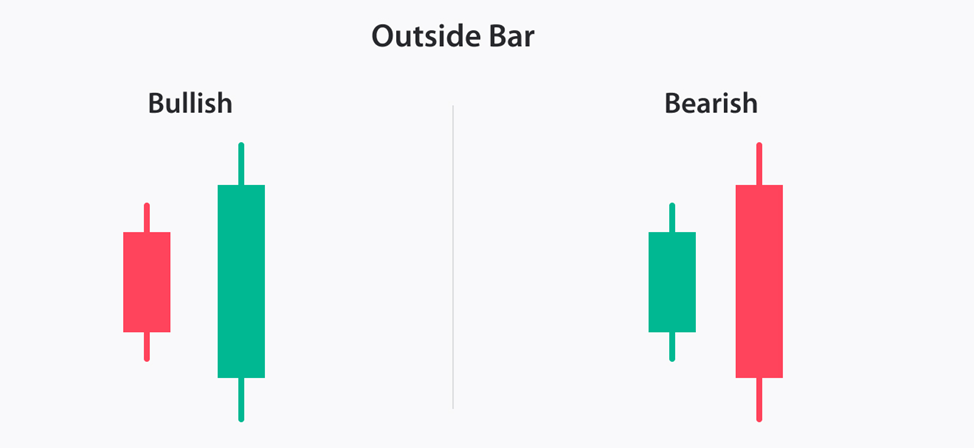
A bullish outside bar pattern is formed when a small bearish candle comes before a large bullish one. The opening price of a bullish candle may be lower than that of the prior bearish candlestick. In other circumstances, the two candlesticks’ opening prices are the same.
What matters is that the bullish candle’s closing price is significantly higher than that of the prior bearish candlestick. This is when the bullish outside bar candlestick pattern forms. Besides, the bullish outside bar is a dependable indicator of possible trend reversals, implying that bearish momentum is fading and bullish momentum is taking control.
The bearish outside bar pattern forms in the same way as the bullish pattern but in the opposite order. This means the bearish pattern consists of a large bearish candle engulfing a little bullish one. It also serves as a dependable indicator for possible trend reversals, signifying diminishing bullish momentum and increasing bearish momentum.
Trading Strategies Using Outside Bars
There are three main approaches for outside bar trading. The first is reversal trading, the second is trend continuation trading and the third is breakout buildup.
Reversal Strategy with Outside Bar Candlestick Pattern
The reversal strategy is a popular trading technique that uses outside bars. Traders adopting this trading strategy look at the relationship between the present outside bar and the previous bar (the previous day’s trading session) to determine market sentiment and possible price direction.
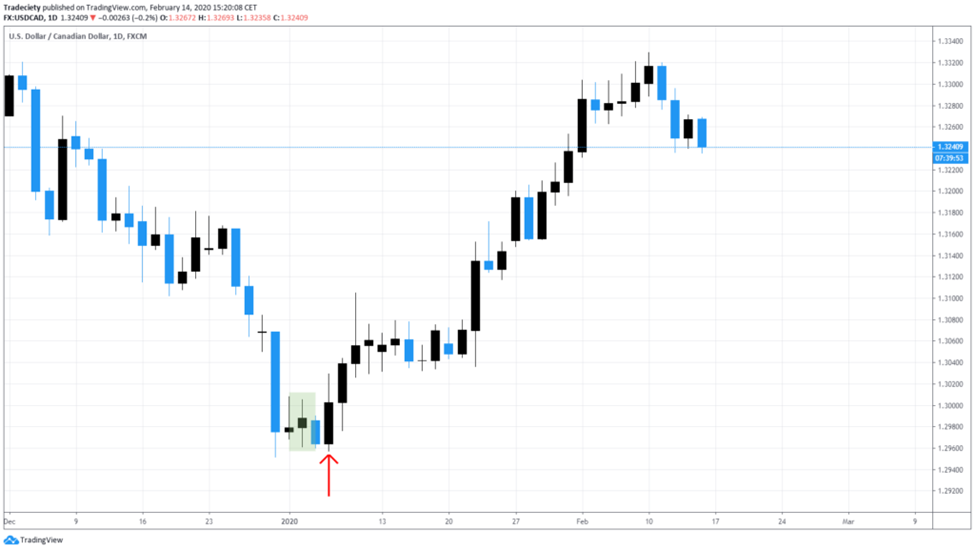
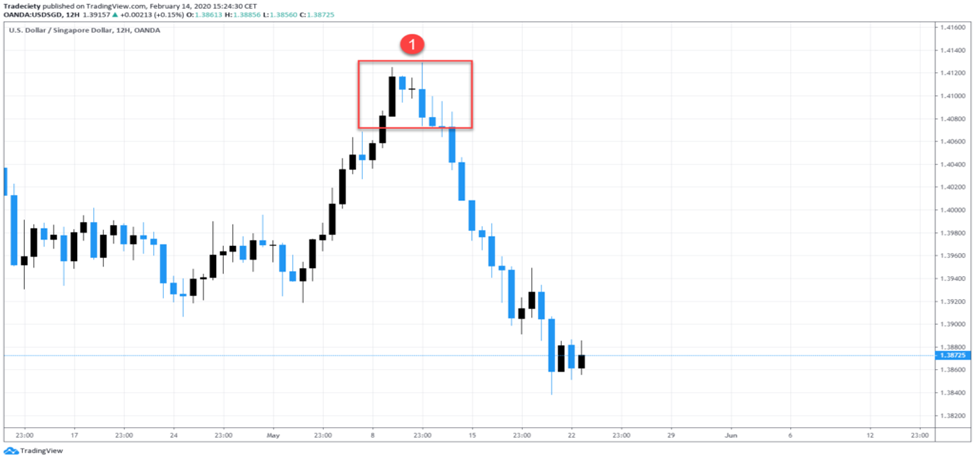
This occurs following a long momentum candle when the momentum abruptly decreases, indicating a lack of trend support. For instance, the downtrend came to a sudden halt in the chart below as numerous successive tiny inside bar candles appeared after the long momentum candle. After three inside bars, the momentum abruptly changed, and a strong outside bar flipped the price upward. This is a famous reversal sequence that effectively depicts the turning momentum.
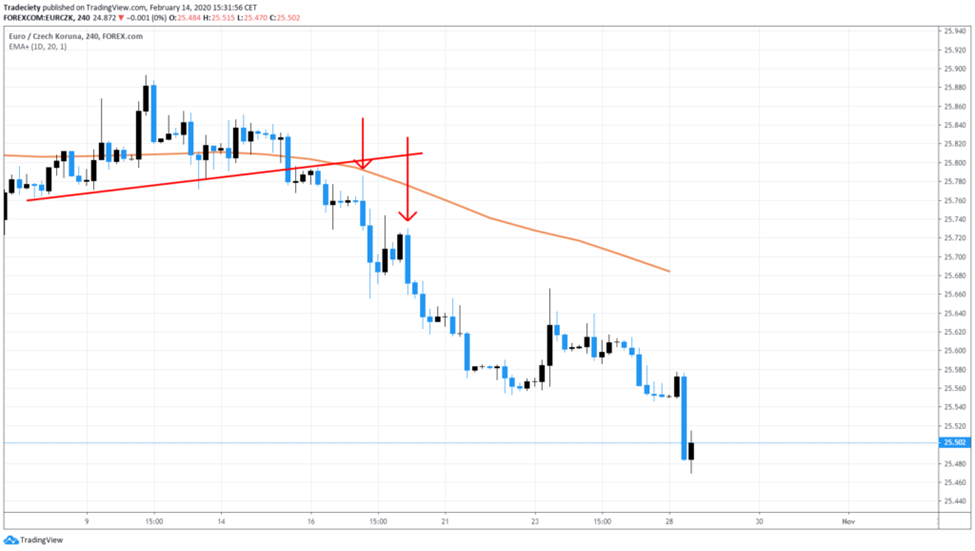
The chart below shows a similar pattern, and the candle sequence foretold the following downtrend. Following several successive bullish candlesticks, the momentum decreased, and two extremely small inside bars signified the conclusion of the bullish trend. A strong bearish bar then signaled the start of the new downtrend.
To increase the likelihood of spotting high-probability reversals, only look for such candle sequences during over-extended trends, which have been ongoing for an extended period. The longer a trend remains in place, particularly in the Forex market, the more likely it is that a candlestick pattern represents the beginning of an opposite trend.
Trend Continuation Strategy with Outside Bar Candlestick Pattern
The continuation strategy is a trading strategy that uses outside bars to recognize continuation patterns in existing trends in the market. It relies on using outside bars to identify a continuation of the current trend instead of a reversal.
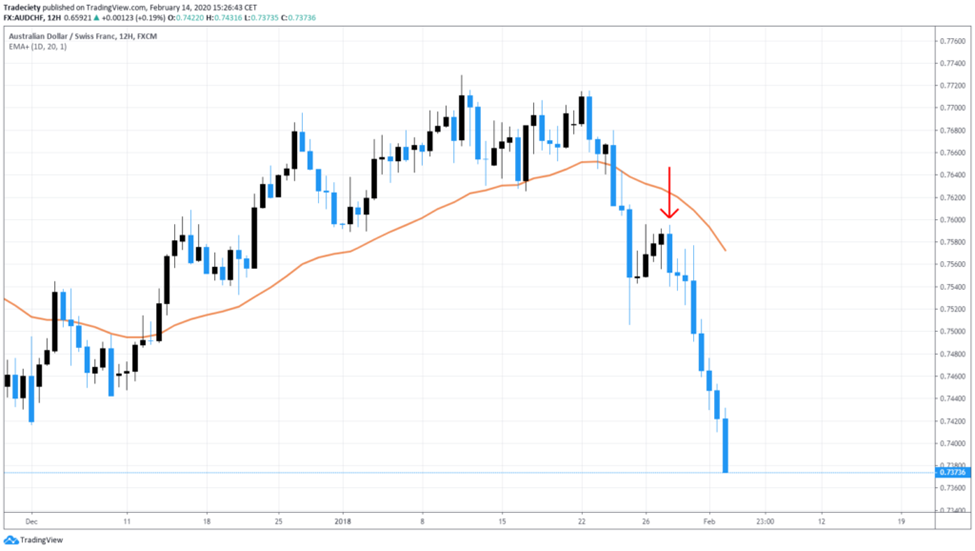
When outside bar sequences appear during pullbacks, they might serve as trend continuation signs. The orange long-term moving average in the image below indicates that the market was in a downward trend. Consolidations are common during trending periods when the market goes sideways. The trend persists when the power balance between buyers and sellers shifts again, pushing the price in the initial trend direction. It could be an essential sign that suggests further momentum to come.
The image below depicts a similar issue. The price was in decline, as seen by its position under the long-term moving average. The trader would wait for a bullish retreat and trade when an outside bar in the initial trend direction appears.
Needless to say, trends seldom last forever, and trading merely the first or second decline can reduce the danger of entering a trend too late.
Tips for Trading the Outside Bar Candlestick Pattern
- Don’t be concerned about the colors.
- Examine the entire candle, not just its wick or the body.
- Be cautious of false signals in crucial locations, as not all confirmed candles will be successful.
- Use the candle’s high and low as stop-loss levels and hold them tight.
- Trading with the trend is better than against it, as it often indicates a continuance of the trend.
- Avoid trading large candles, as they may raise your stop-loss. Trade wisely.
Advantages and Disadvantages of an Outside Bar Pattern
Advantages of Outside Bar Candlestick Pattern
- Outside bar patterns are visually distinctive, rendering them easy to locate on price charts.
- Bullish or bearish outside bar patterns can signal possible trend reversals, giving traders apparent entry and exit points for trading.
- Trading an outside bar pattern enables traders to establish objective criteria for entry and exit points, decreasing emotional biases and encouraging a disciplined trading style.
- If you notice these patterns on your daily charts, you may have caught a full trend reversal that may be quite profitable.
- Outside bar patterns can be employed in various trading techniques, providing traders with a versatile tool for varying market conditions.
Disadvantages of Outside Bar Candlestick Pattern
- Stop-loss distances can be significant (the greater the time frames, the bigger the stop loss), therefore, you must calculate lot sizes according to the risk you are ready to take. This typically entails small position sizing.
- Quick wins are uncommon. The outside bar can have already passed the preceding candlestick.
- Outside bars appear all over the Forex chart. Avoid trading them without an additional variable, like support/resistance zones.
- Outside bars can cause false breakouts, as prices quickly advance beyond the bar’s high or low before retreating and trapping traders in losses.
Conclusion
In conclusion, trading outside bar candlestick patterns in the market can be a useful approach for recognizing possible trend reversals or continuations. They are a popular tool among traders due to their obvious visual indications, which provide objective entry and exit criteria to avoid emotional biases and maintain disciplined trading strategies.
Outside bar patterns can be used as standalone trading signals, but they are far more powerful when supplemented with price patterns or fundamental analysis.
However, it is critical to understand the restrictions of trading an outside bar pattern. Occasional false breakouts are possible, which highlights the significance of risk management and the requirement to validate outside bar signals with additional analysis techniques.


