

The concept of the Disparity Index was introduced by Steve Nison, a renowned technical analyst and author, in his book “Beyond Candlesticks: New Japanese Charting Techniques Revealed.”
Steve Nison is widely recognized for his contributions to the field of technical analysis, particularly in popularizing Japanese candlestick charting techniques in the Western world.
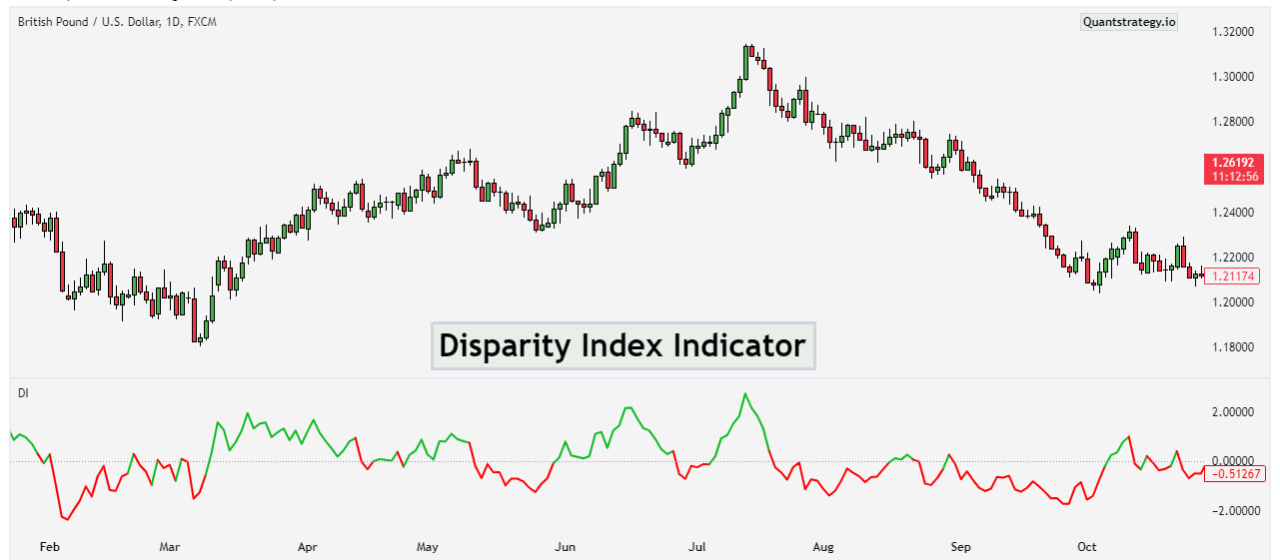
What is Disparity Index
The Disparity Index is a technical indicator that measures the relative difference between the current price and a selected moving average. It helps traders identify overbought or oversold conditions in the market.
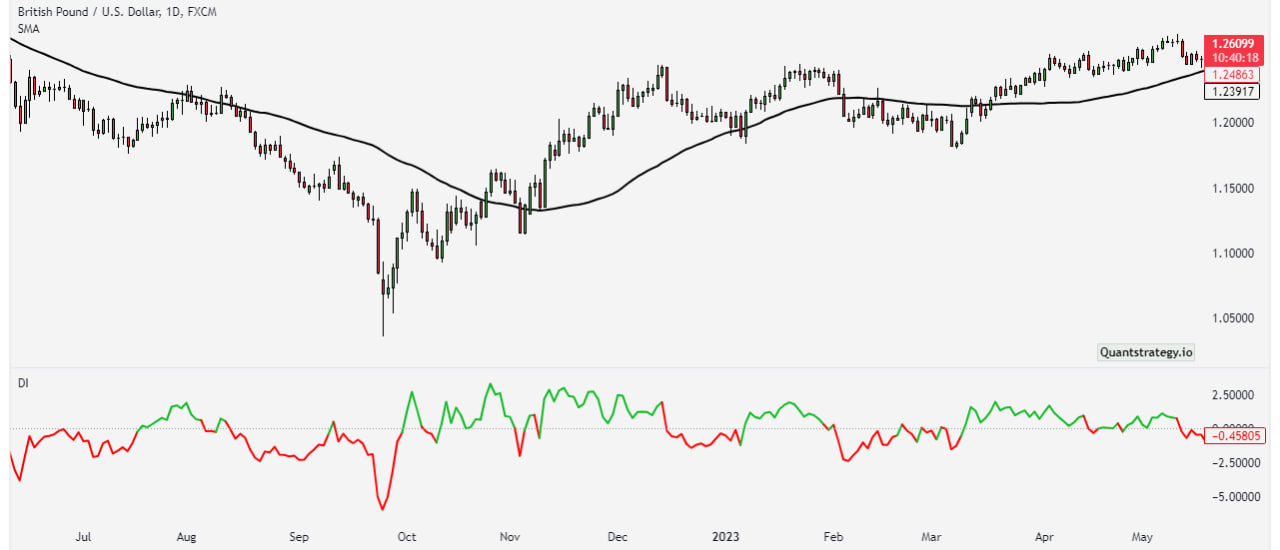
Calculating the Disparity Index involves comparing the current price to a moving average, typically the simple moving average (SMA) or exponential moving average (EMA), over a specified period.
The DI was developed as a means to measure the discrepancy or disparity between the current price of an asset and its moving average.
Trading Strategies with the Disparity Index
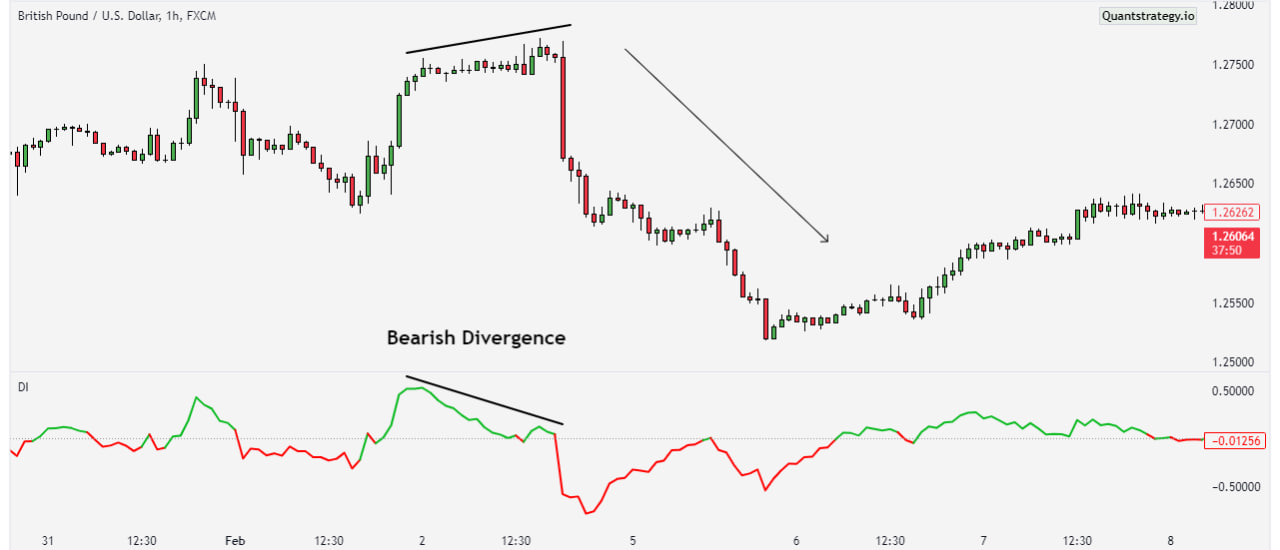
Traders can employ various strategies using the DI to navigate the markets. One common approach is trend identification, where traders look for divergences between the DI and price movements to anticipate potential trend reversals.
Additionally, traders can use the DI to determine entry and exit points, with buy signals generated when the index is below a certain threshold and sell signals when it surpasses another threshold.
Buy Condition:
- The Disparity Index indicator crosses above the zero line indicating that the current price is trading higher than the average price.
- The Disparity Index crosses above a specific threshold level, such as +1, suggesting that the current price is significantly higher than the average price and indicates a potential buying opportunity.
- The Disparity Index shows a positive divergence with the price, meaning that the price is moving lower while the Disparity Index is moving higher. This could indicate that the price is about to reverse and provides a buy signal.
Sell Condition:
- The Disparity Index indicator crosses below the zero line, indicating that the current price is trading lower than the average price.
- The Disparity Index crosses below a specific threshold level, such as -1, suggesting that the current price is significantly lower than the average price and indicates a potential selling opportunity.
- The Disparity Index shows a negative divergence with the price, meaning that the price is moving higher while the Disparity Index is moving lower. This could indicate that the price is about to reverse and provides a sell signal.
- xan, The Disparity Index reaches an extreme overbought level, such as +2 or higher, indicating that the price has moved significantly higher than the average price and may be due for a pullback or correction. This can be considered as a sell signal.
Formula and Calculations
The Disparity Index is calculated by comparing the current price of an asset to a selected moving average over a specific period. The formula for calculating the DI is as follows:
Disparity Index = ( Current Price/ Moving Average – 1 ) × 100
In this formula:
- Current Price: Refers to the most recent price of the asset.
- Moving Average: Represents the chosen moving average, typically the simple moving average (SMA) or exponential moving average (EMA), calculated over a specified period.
- Disparity Index: Indicates the relative difference between the current price and the selected moving average, expressed as a percentage.
Once the DI is calculated, traders can interpret its values to gauge the momentum and trend direction of the asset.
Positive values suggest that the current price is above the moving average, indicating bullish momentum, while negative values indicate that the current price is below the moving average, signaling bearish momentum.
Advantages and Disadvantages
The Disparity Index offers several advantages to traders. It provides flexibility in different market conditions, making it suitable for both trending and ranging markets. Moreover, the DI can complement other technical indicators, enhancing the overall effectiveness of trading strategies.
Despite its benefits, the Disparity Index has some drawbacks that traders should be aware of. One potential downside is its tendency to produce lagging signals, especially during periods of rapid price changes.
Additionally, the DI may generate false signals in choppy or sideways markets, leading to potential losses for traders.
Tips for Effective Use of the Disparity Index
To maximize the utility of the DI, traders should consider certain tips.
Firstly, it’s crucial to set appropriate parameters for the indicator based on the characteristics of the asset being traded and the desired trading timeframe.
Moreover, traders should confirm signals generated by the DI with other technical indicators or market analysis to validate their accuracy.
Common Mistakes to Avoid when Using the DI
While the DI can be a valuable tool, traders should be mindful of common mistakes. One such mistake is over-reliance on the indicator without considering other factors such as fundamental analysis or market sentiment.
Additionally, ignoring the broader market context can lead to misinterpretation of signals generated by the DI.
What is Fractional disparity?
Fractional disparity meaning in forex refers to the difference between the current price of a currency pair and its fractional value, often expressed in terms of pips.
In forex trading, a pip is the smallest unit of price movement, typically representing one ten-thousandth of a currency unit.
Fractional disparity arises when there is a slight variance between the quoted price and its fractional value, which can occur due to factors such as market liquidity, order execution speed, and broker spreads.
Conclusion
In conclusion, the Disparity Index is a versatile technical indicator that can aid traders in making informed decisions in the markets.
By considering its calculation, interpreting its signals, and applying effective trading strategies, traders can leverage the DI to enhance their trading performance.
The essence of understanding disparities lies in recognizing the varying degrees of difference within societal structures.
By acknowledging and addressing disparity in both societal and financial realms, individuals and groups can work towards fostering greater equality and opportunity for all.
However, it’s essential to acknowledge its limitations and exercise caution in its usage to avoid potential pitfalls.
FAQs
Is the Disparity Index suitable for all types of assets?
While the Disparity Index can be applied to various assets, its effectiveness may vary depending on market conditions and asset characteristics.
Can the Disparity Index be used as a standalone indicator?
While some traders may use the Disparity Index alone, it’s generally advisable to complement it with other technical indicators or market analysis for better accuracy.
How often should I adjust the parameters of the Disparity Index?
The adjustment of parameters such as the moving average period should be based on the volatility and behavior of the asset being traded, typically requiring periodic review.


