
Successful trading is an art that necessitates a thorough understanding of numerous market conditions. One critical factor that traders frequently neglect is selecting the appropriate time frame. The selected time frame can significantly impact your trading selections and overall success. It furnishes traders with important insights regarding identifying trends and market dynamics.
Moreover, trading on multiple time frames is necessary for traders wanting to optimize their strategies.
So, in this post, we will look at how to choose the best time frame for your trading style and how adding multiple time frames into your analysis may lead to more informed and profitable trades.
The Best Time Frame – What Does a Time Frame Mean Actually?
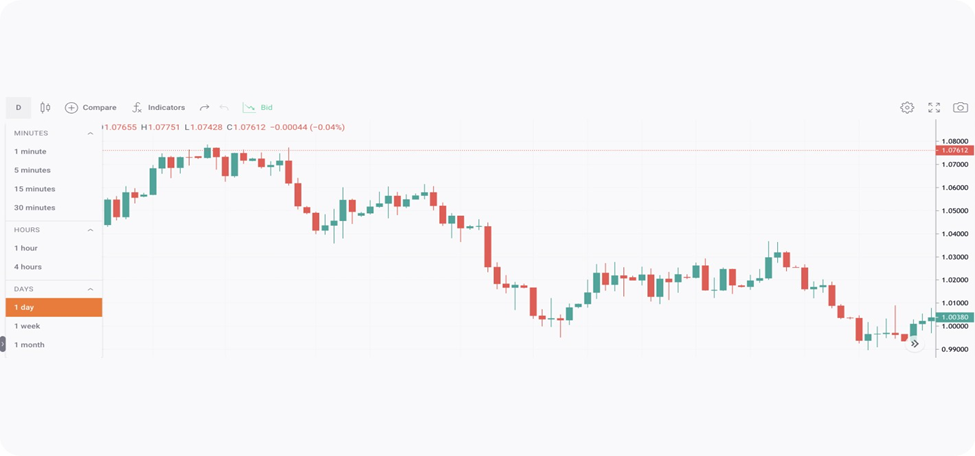
At its most basic, a time frame represents the trading session of a specific duration symbolized by each bar or candlestick on a price chart. It denotes the amount of time included in a single data point, which can be 1 minute, 5 minutes, 15 minutes, and so on.
For instance, if the time frame is 5 minutes, it implies that you’ll see how the price changes every five minutes on the chart of the selected asset. In the case of bars or candlesticks, it means that a new candle or bar will appear on the chart every 5 minutes. And if the time frame is one day, a new bar or candle will appear every new trading day.
In essence, the time frame reflects a security’s price action within a specified period. The time frame you pick for your chart determines how frequently it provides price data, which you will need for market research. It can be altered to cover 5/15/30 minutes or even a complete year in a snap.
As a result, it influences your trading decisions, such as when you initiate a trade, how you manage it, when you exit it, and how much revenue you can make from it. Time frames are critical for traders because they provide many perspectives on market movements and allow for detailed examination of price behavior at various degrees of granularity.
Furthermore, the time frame you select defines the size of the individual price bars and, as a result, the size of the price fluctuations, which is what you attempt to make money. The outcome is that the higher time frames you trade on, the larger your stop loss and profit targets.
Types of Time Frames
To truly grasp how important time frames are in trading, you must first comprehend the three basic categories – short-term, medium-term, and long-term. Most traders employ three time frames, however, some like to use more. Each category has various characteristics and is best suited to different trading strategies.
- Short-term: These time frames include 1-minute, 5-minute, and 15-minute charts, depending on your trading style. Traders employ them when attempting quick trades, frequently within the same day. Because these traders thrive on rapid price movements and are skilled at capitalizing on these opportunities, the short-term time frame is primarily used for entries.
- Medium-term: These time frames are mostly employed by swing traders. They can be 5-minute (for scalpers) or 15-minute (for day traders). Medium-term timeframes are the ideal balance between long-term and short-term timeframes, and they frequently contain 30-minute, one-hour, and four-hour charts. They are frequently used in trades that last one day to a week. They enable a more detailed examination of price trends and present us with the current market bias.
- Long-term: These time frames are deployed by position traders for analyzing market trends. Monitoring a transaction from these long-term (higher) time frames to smaller ones is known as multi-timeframe analysis. A daily chart, a weekly chart, and a monthly chart are the most commonly utilized timeframes for long-term trading. Traders consider these for trades that last from a week to many months.
Selecting the Suitable Time Frame Combinations
Now that we’ve established the significance of selecting the appropriate time frame for your trading strategy, how do you choose the best combination? This essential decision should be influenced by several considerations. Here are a few examples:
- Trading Objectives: Traders frequently begin by defining their trading objectives, whether they’re into day trading, swing trading, or long-term investment. This aids in the selection of appropriate time frames that correspond to these goals.
- Market Volatility: The degree of market volatility can have a significant impact on the acceptability of time frame combinations. Shorter time frames may be preferable in highly volatile markets, while longer time frames may be chosen in calmer markets. As a result, monitoring current market behavior should come before deciding which time frame combinations to trade.
- Personal Preference: Every trader has their trading approach and preferences, and they should keep this in mind while deciding on trading time frame combinations. Short timeframes may suit certain traders due to their strong volatility, whereas others may prefer a calmer approach. It is impossible to overestimate the importance of matching one’s time frame preferences to one’s personality and trading objectives.
- Primary & Secondary Time Frames: Traders typically employ a primary time frame for analysis and one to two secondary time frames for verification. A day trader, for example, would use a 15-minute chart as the primary chart and then utilize 1-minute and 1-hour charts for a broader context.
- Compatibility: It’s critical to pair compatible time frames. Secondary time frames are frequently selected with a factor of 4 to 6. If the primary chart is 15 minutes long, a 1-hour chart (factor of 4) or a 4-hour chart (factor of 16) could be appropriate secondary time frames.
- Risk Tolerance: When deciding on time frame combinations, traders must think about their risk tolerance. Shorter time frames are frequently associated with increased volatility and more rapid trading, which can raise risk. Longer time frames may offer a more stable and reliable trading environment, but they also need greater patience.
- Flexibility: Time frame selection requires a high level of flexibility. Traders must be prepared to respond to shifting market conditions. Being willing to switch between time frames or change your approach can help you manage complex market dynamics.
- Trial & Review: Traders typically use historical data to back-test different time frame combinations to fine-tune their strategy. This iterative procedure can aid in refining the efficacy of the multiple-time frame strategy.
How to Decide the Best Chart Time Frames for Trading?
As previously said, the optimal time frame to trade will vary based on the trading strategy you choose to achieve your individual goals. There is a clear relationship between different time frames and trading techniques. But, before you can decide which timeframe is optimal for trading, you must first decide what type of trader you would like to be. Some traders, like scalpers, trade in very short time frames, whereas others trade over a longer period. The ideal time frames to trade can vary according to your trading style.
Scalping
Scalping is entering and exiting the Forex market in a matter of minutes. Traders who employ this strategy prefer to execute several trades at short intervals during the session. They intend to profit from small price movements. As a result, scalpers use the smallest time frames, ranging from 1 to 30 minutes. However, the one or two-minute time frames are favored by them. They use these time frames to spot quick trading opportunities and make split-second entry and exit choices.
Scalping Example
Select a highly liquid currency pairing before you action this trading approach. Buy into the market and monitor market movements, using trend analysis to determine key entry points. You may then purchase a particular quantity of your selected currency and wait for it to go up somewhat within a one-minute interval. When it reaches a certain level, you sell the stock and bank the earnings, then repeat the procedure. If it doesn’t move up by the end of the one-minute time frame, you will sell at a little loss before attempting to profit from a fresh one-minute time frame.
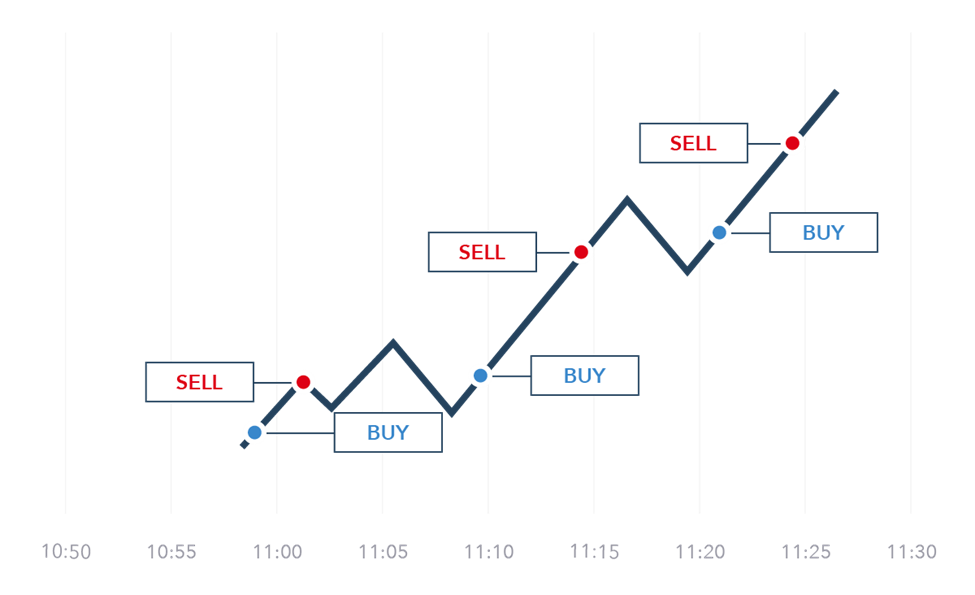
You can reduce your chance of loss by implementing an adequate exit strategy that protects your tiny profits from being wiped out by a single major loss.
Swing Trading
Swing trading entails holding positions for a few days to a few weeks, with a focus on utilizing longer time frames to analyze price movements and trends and to find patterns. Swing traders use higher charts, often between 4 hours and a week, because they typically hold their trades open for more than a day.
Swing trading is a happy balance between long-term trading time frames and short-term scalping techniques. One of the best advantages of swing trading is that traders can reap the benefits of both approaches without incurring all of the disadvantages. This makes it a very popular market method.
Swing traders will examine the charts a few times every day to see if there are any large price moves in the market structure. This gives traders the benefit of not constantly monitoring markets while trading.
A further benefit of this strategy is that the trader is still looking at charts frequently enough to grasp chances when they arise. This addresses one of the drawbacks of longer-term trading, in which entries are usually placed on weekly/daily charts.
Swing Trading Example
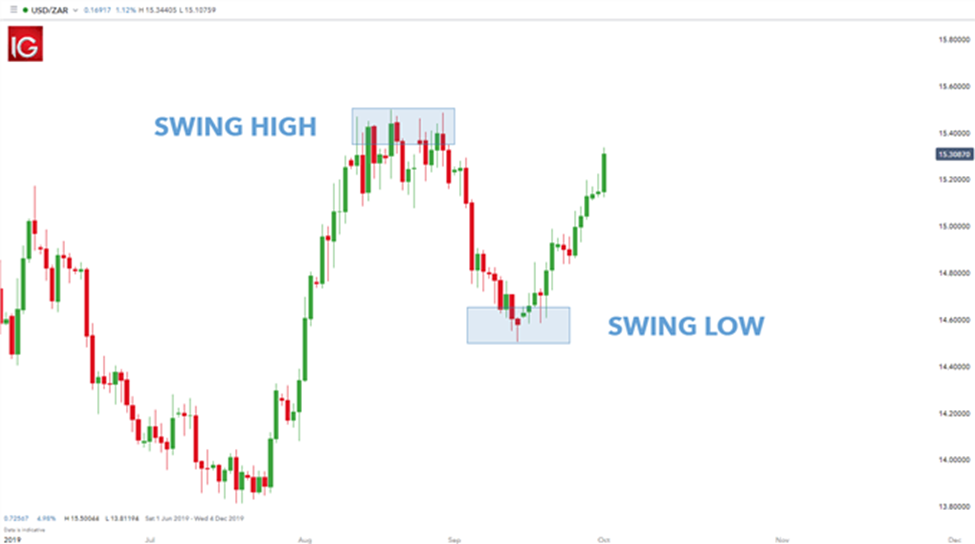
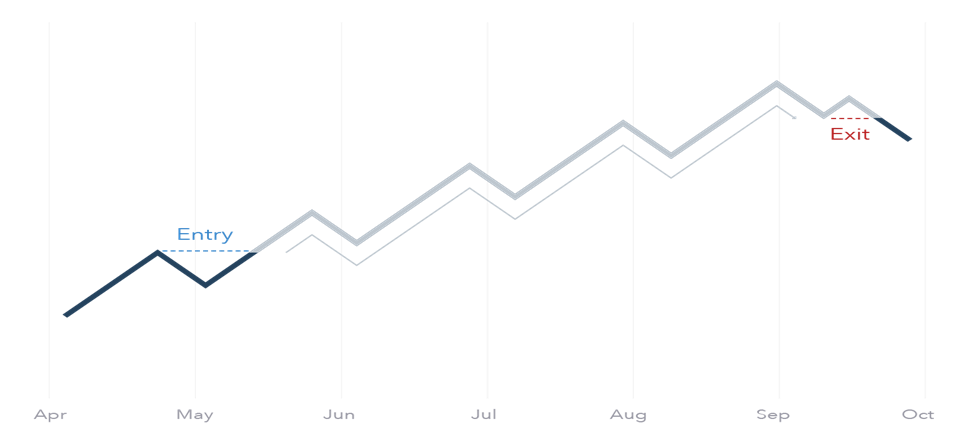
The daily chart is frequently used for determining trends or general trend direction in this method, while the four-hour chart is utilized for entering trades and setting positions (see below). The daily chart displays the most recent swing high and low. Traders typically trade swings back in the direction of the prior trend, which, in this case, is upwards.
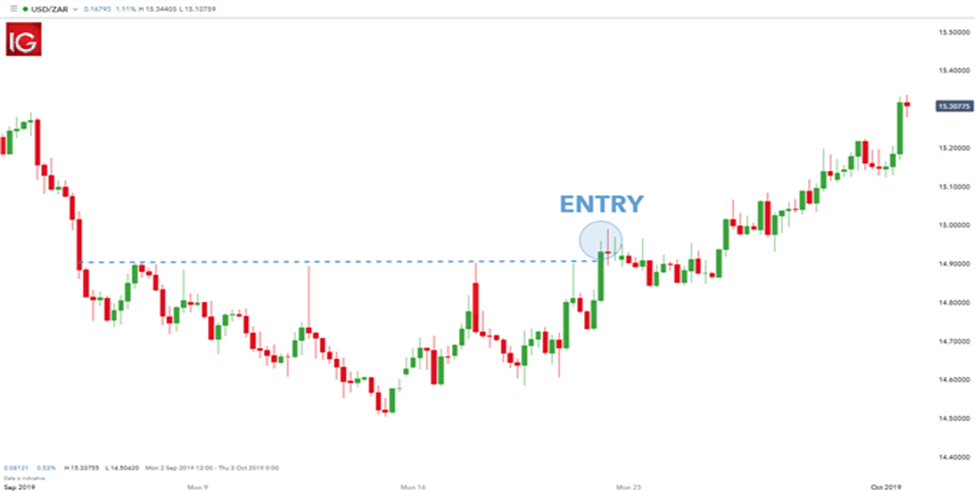
After the trade direction has been determined, the swing trader will reduce the timeframe to four hours to seek entry points. In the example below, there’s a definite price resistance level that the swing trader will consider when starting a long trade. Traders may choose to enter when the price breaks or the candle closes over the selected resistance level.
Position Trading
As the name implies, position traders enter into a position in a specific forex market and hold it with the expectation that its value will improve over time since they need to get a detailed market picture. These traders will make just a few trades, and they will most likely work over long periods, such as several weeks, months, or even a year.
Position traders, unlike traditional ‘buy and hold’ investors, do not just lock their money away eternally. These investors are trend followers, and their goal is to identify trends, invest in them, and then exit when the trend hits its apex.
Position Trading Example
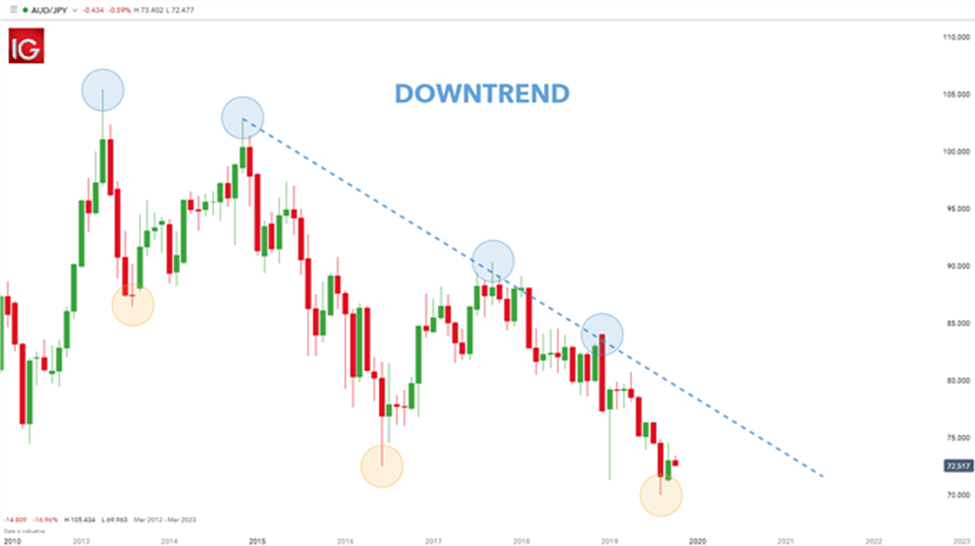
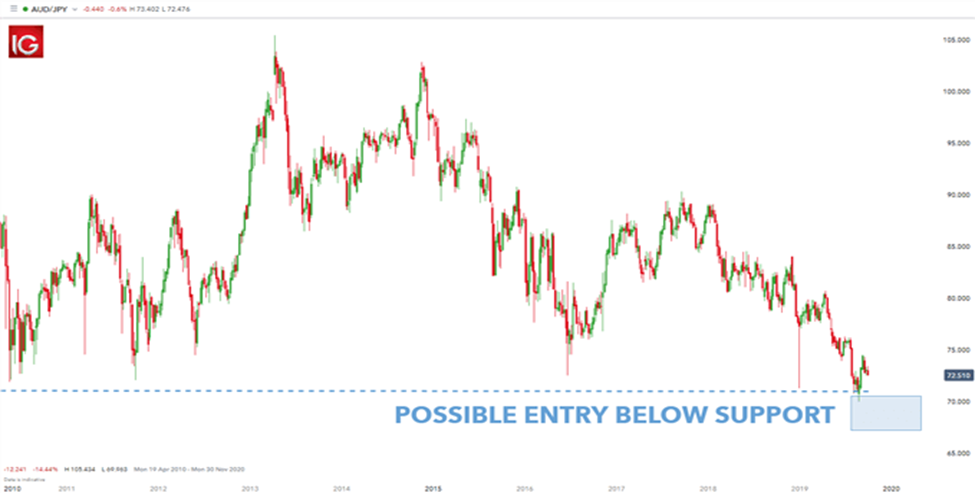
Once the trend on the monthly chart has been determined (lower highs and lower lows), traders can try to begin positions on the weekly charts in a variety of ways. Many traders look to price movement (as demonstrated by the weekly chart below) to determine trends and/or enter positions, although indicators can also be used.
Day Trading
Day trading is another approach that employs minor price swings during the trading day, as it entails closing positions on the same day they were opened. Like scalpers, day traders, frequently use short time frames with most selecting time frames ranging from 15 minutes to 4 hours. This enables day traders to choose from a variety of time frames based on the liquidity of their selected market, the length of time they have to execute their trades, and their chosen trading approach.
A time-pressed forex trader, for example, would employ a 15-minute timeframe to generate rapid profits in a liquid market over a shorter period. A full-time day trader may employ daily and hourly time frame analysis to spot emerging trends and select the optimum market entry point. However, day traders must be careful to create tight exit points once they’ve entered their selected market and monitor price moves regularly. A badly planned deal can potentially wipe out an entire day’s earnings.
Day traders, like longer-term traders, might look to assess trends on the hourly chart and find entry opportunities on ‘minute’ time frames like five or ten-minute charts. The one-minute time frame is also a possibility, but it should be approached with extreme caution because the fluctuation on the one-minute chart can be quite unreliable and hard to deal with. Once the trend has been defined, traders can utilize a variety of triggers to initiate trades – price action or technical indicators.
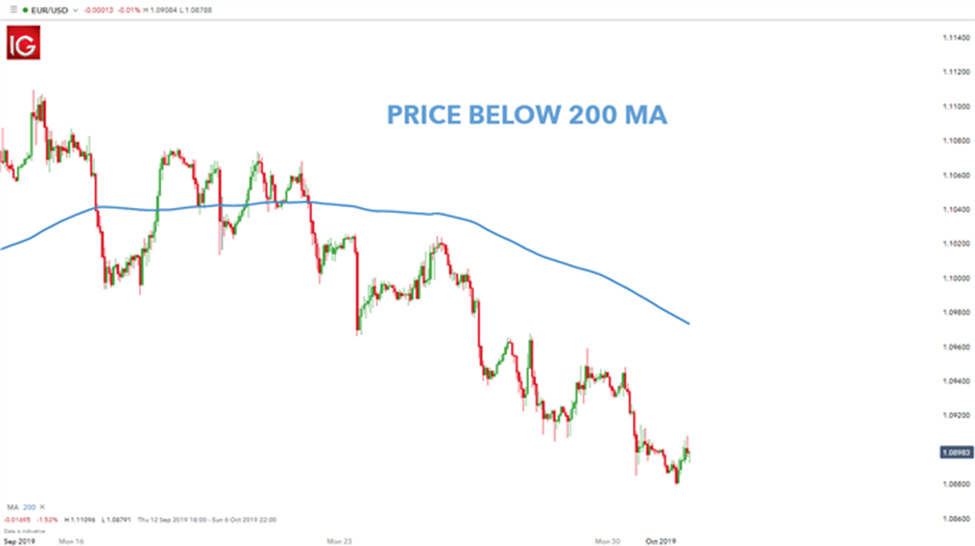
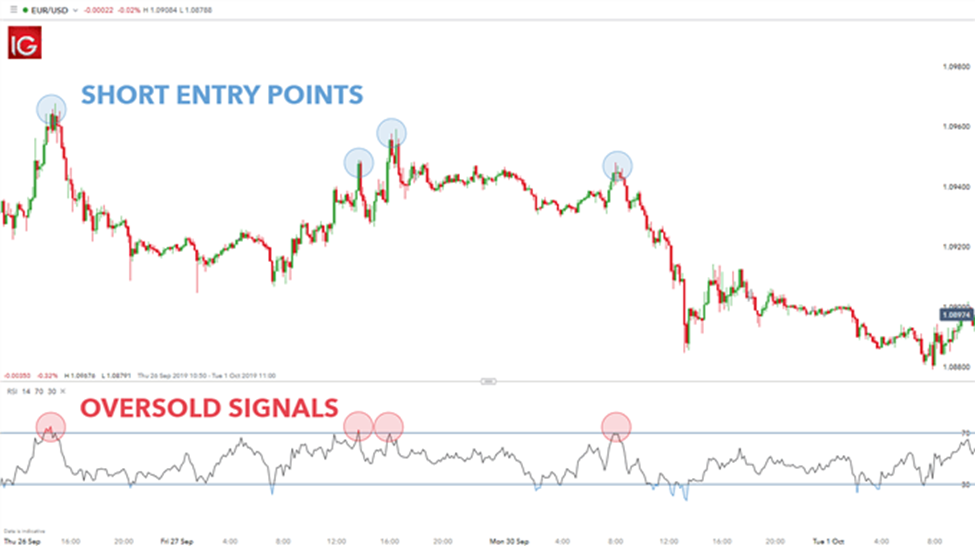
Day Trading Example
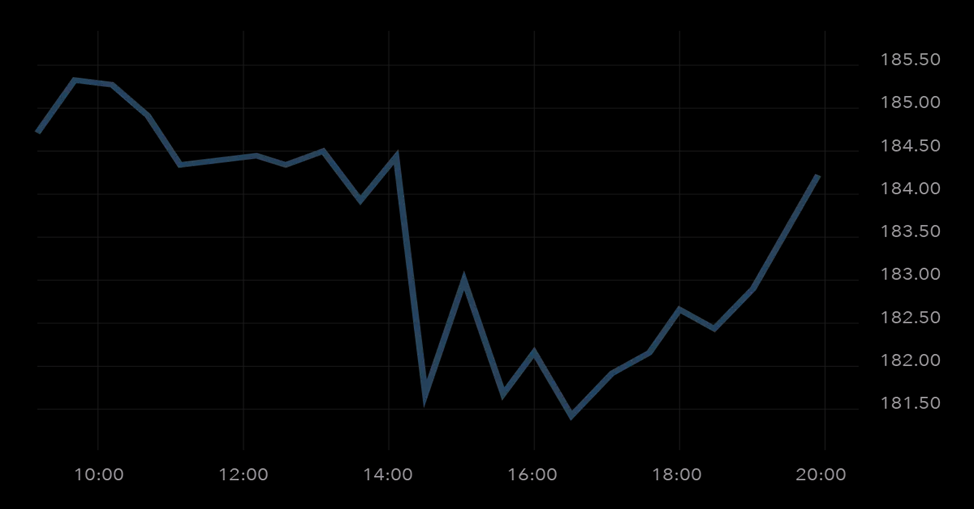
The hourly chart is used to identify the trend in the charts below, with a price below the 200-day moving average suggesting a downtrend. The RSI indicator is used in the second 10-minute chart to help with short-term entry points. In this scenario, the trader only notices overbought signs on the RSI (marked in red) due to the longer-term preceding downward trend.
Multi Time Frame Analysis
As previously stated, the time frames used in the foreign currency market are determined by the strategy employed. However, this does not imply that a trader focuses only on a single time frame. Many investors utilize a multi-timeframe analysis in which the same currency pair is examined but from different periods.
Traders usually use three time frames. They enter a trade on the medium, examine a general pattern with strong support and resistance levels on the longest, and assess potential hazards for entering/exiting trades on the shortest.
Multiple timeframe analysis approaches can assist you in handling multiple trading positions at once without raising your risks. Indicators can be used with this trading strategy as well.
Strategies for Trading at Multiple Intervals
When adopting multiple time frame analyses, traders usually apply several approaches to improve their trading decisions. Confluence, trend analysis, and price action confirmation are among the most common.
- Confluence: This strategy involves locating points where several indicators match over distinct periods. For example, if a Fibonacci retracement level on a daily chart aligns with a moving average on a four-hour chart, it could indicate a good trade possibility. Confluence lends weight to trading signals, rendering them more dependable. In a multiple-time frame analysis, an indicator that exhibits similar signals over different times can also serve as confirmation.
- Trend Analysis: An essential component of multiple time frame trading, trend analysis seeks to detect the direction of market movement over different time intervals. Traders can evaluate general market sentiment by looking at both short and long-term patterns. Moving averages, trendlines, and other indicators are frequently used to visually show and corroborate these trends.
- Price Action Confirmation: In this case, traders look to short periods for particular trends or configurations that confirm what they’ve seen in larger periods. For instance, if a long-term trend is bullish, traders may wait for a bullish candlestick formation to confirm entry points on a short-term chart.
Conclusion
There is no ideal timeframe for trading the financial markets – it all revolves around you — what is perfect for another trader might not be the most suitable timeframe for you.
Experiment with different timeframes on a demo trading account to find out what works most effectively for you and stick to it. However, no matter what timeframe you trade, always strive to undertake a multiple timeframe analysis to gain a complete market picture in every situation.