
Chart patterns are extremely crucial for price action traders. They serve as a useful tool for predicting future price trajectories, and the triple bottom pattern is one of the most popular bullish reversal patterns.
Much like its twin, the triple top pattern, it is popular because its reliable, precise, and produces traders a respectable average profit.
Triple bottom chart patterns are easy to identify and, if seen, can be readily used as an aspect of technical analysis to develop a trading strategy.
But what do triple bottom patterns look like? And how can traders use them in forex trading? We will review this chart pattern below and discuss how to produce a trade idea once these chart patterns are identified.
What are Triple Bottom Chart Patterns?
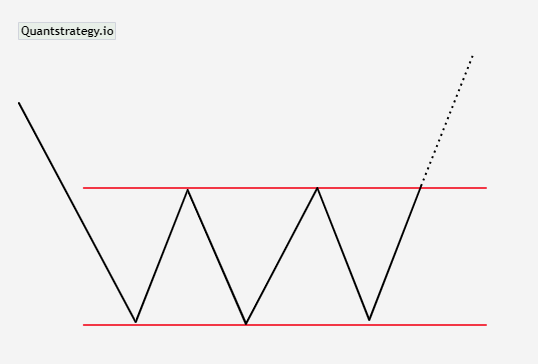
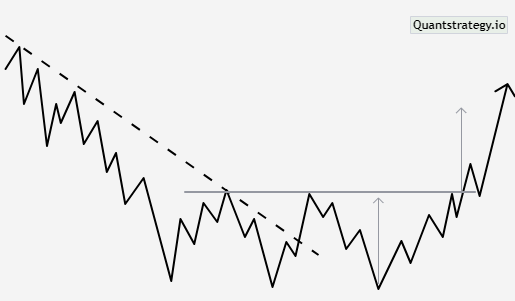
Triple bottoms are extensions of double bottoms. If the double bottom pattern resembles the letter ‘W’, the triple bottom chart has the shape of three Latin letters ‘VVV’. This is why even a novice can spot them easily on a price chart.
A triple bottom pattern occurs at the termination of a downtrend. It is a bullish reversal chart pattern that represents three failed attempts at new lows close to the same price and is verified once the price breaks above the resistance.
The triple bottom pattern appears after price corrections have been moving lower. The market starts to recover but stops short of continuing to rise. Additionally, the market trades in a sideways range, and each failed rebound is followed by a failed attempt at new lows. When sellers are entirely worn out, the market bounces back a third time, but this time, with enough vigor to break out higher.
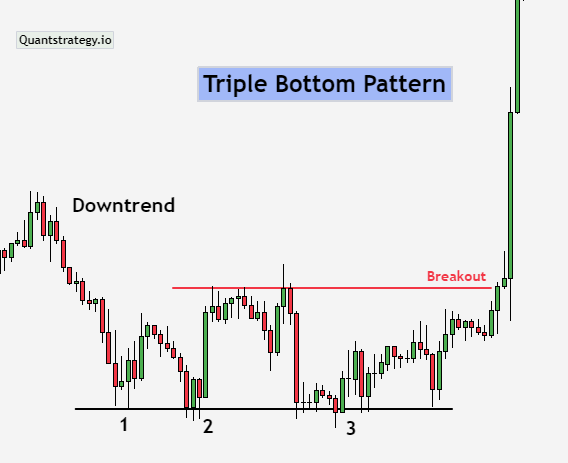
The chart pattern looks like the letters ‘VVV’ as the lows of the triple bottom form close to the same price level. According to some traders, the triple bottom pattern also resembles a rectangle. Both interpretations are correct because the formation is a bullish reversal setup.
Understanding the Triple Bottom Pattern
The triple bottom pattern usually emerges after a protracted downtrend in which bears are in charge of the trading market. The first bottom might have just been ordinary price action, whereas the second bottom indicates that the bulls are gathering momentum and getting ready for a potential reversal. The third bottom demonstrates the presence of solid support. The bears may give in when the price breaks above the resistance level.
The triple bottom chart pattern consists of many candlesticks, which form three valleys or support levels that are either of the same or roughly equal height. The breakout happens when the third valley forms and cannot hold support beyond the first two valleys.
This technical analysis pattern is a bullish reversal formed in a bearish trend. Professional traders are always on the lookout for chart patterns for entry and exit points. The triple bottom pattern is made of three equal lows and a breakout above resistance.
It contains a group of candles where each candle has its own story, however, they paint a larger picture when grouped. The triple bottom pattern is indicative of the struggle between sellers and buyers. The sellers become exhausted and give way to buyers to alter the prevailing trend and become successful with an uptrend.
The below figure demonstrates a triple bottom pattern that once formed on McGraw Hill shares’ daily chart.
The third bounce signifies the demand for the stock at this level, and because it was able to hold it three times, it raises the likelihood that the price will reverse course and move upward. This often indicates that there are several buyers at those prices, and this is what keeps the stock steady.
Identifying the Triple Bottom Pattern
There should be an established and clear downtrend before a triple bottom pattern appears. Next, look for three lows that are almost the same in price and well-spaced from one another. Although the price need not be the same, it should be very near for the trend line to be horizontal.
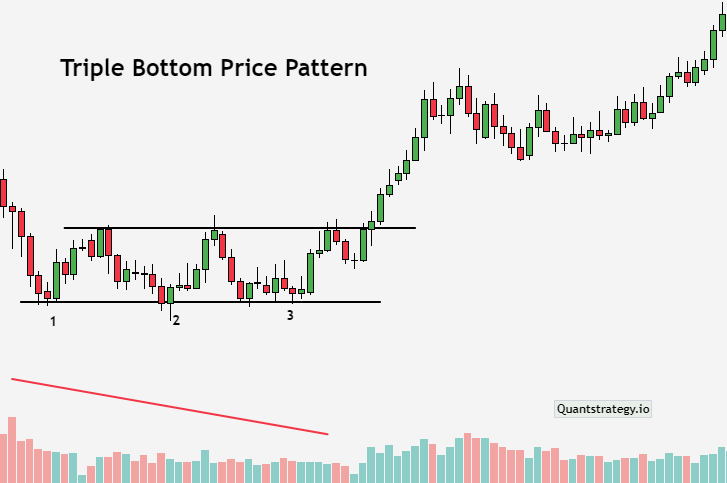
After determining the triple bottoms, watch for a breakout point above the upper resistance line or below the bottoms to confirm a trend reversal. The volumes tend to drop throughout the triple bottom pattern formation to signify that bears are losing momentum, while bullish volumes surge rapidly as the price breaks through the resistance.
How to trade a Triple Bottom Pattern
As mentioned earlier, the triple bottom chart pattern is a bullish reversal chart pattern. This clarifies the trading strategy for this formation, and a trader will essentially be searching for the best entry location to buy the asset. This is accomplished when the breakout occurs and the price of the asset breaks above the resistance line.
After this, the traders will enter the long trade and wait for the asset to rally higher. Considering the extended downtrend, it’s safe to believe that traders and investors have been watching the stock in anticipation of reaching a reliable support level. Investors will begin purchasing the stock once it proves this, driving the price up.
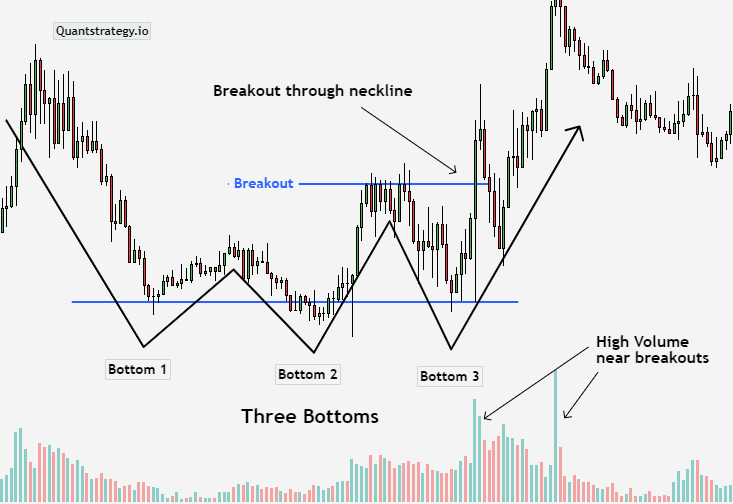
Traders can set a stop loss below the resistance levels. The price target can be established by evaluating the height of the lows and placing the target at that level above the neckline.
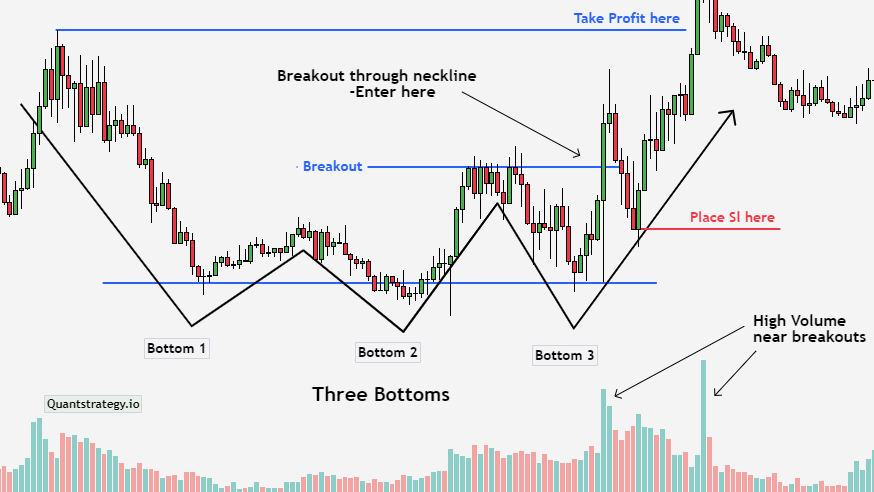
When trading a triple bottom pattern, traders should be aware of volume. For this setup (see chart above), greater volume on the breakout is frequently regarded as confirmation of a trend reversal. This indicates that traders should exercise caution and hold off on placing a trade in any breakout situation until there are higher volumes.
Moreover, traders always prefer confirming the triple bottom chart pattern by using other technical indicators or chart patterns as well.
Triple Bottom Entry & Exit Points
The entry point for a triple bottom formation is where the resistance neckline breaks following the third bottom. The exit point can be identified by setting an initial target close to the neckline or resistance level and then setting the following stops behind it till the trend changes. (Note the chart above)
A trader should always have an exit strategy in place in case of a failed pattern. It’s also crucial to keep in mind that triple bottoms can fail at a rate of 13%. Additionally, risk management is essential because there is still a chance of losing money throughout any trade. Trading professionals can increase revenues while limiting losses by using effective risk management strategies.
Conclusion
The triple bottom pattern is a useful and reliable bullish reversal pattern that is quite rewarding when correctly traded. The chart pattern is easy to identify, and its results frequently outperform our expectations. However, like all other chart patterns, this one still requires confirmation. The triple bottom pattern can be used effectively with technical indicators and other technical analysis tools to assist you take advantage of chances you may have overlooked otherwise and help you make more knowledgeable investment decisions.