


In the fast-paced and ever-changing world of trading, experienced investors are always on the lookout for innovative tools that can provide valuable insights and help them make well-informed decisions.
Trading in financial markets can be like solving a puzzle. You need the right tools to make sense of all the information. One of these tools is the Relative Volatility Index or RVI for short. It’s like a special lens that helps you see how wild or calm the market is.
In this comprehensive guide, we’ll delve deep into the realm of the RVI – what it is, how it operates, and how traders can effectively leverage it to enhance their trading strategies.
What is the Relative Volatility Index (RVI)
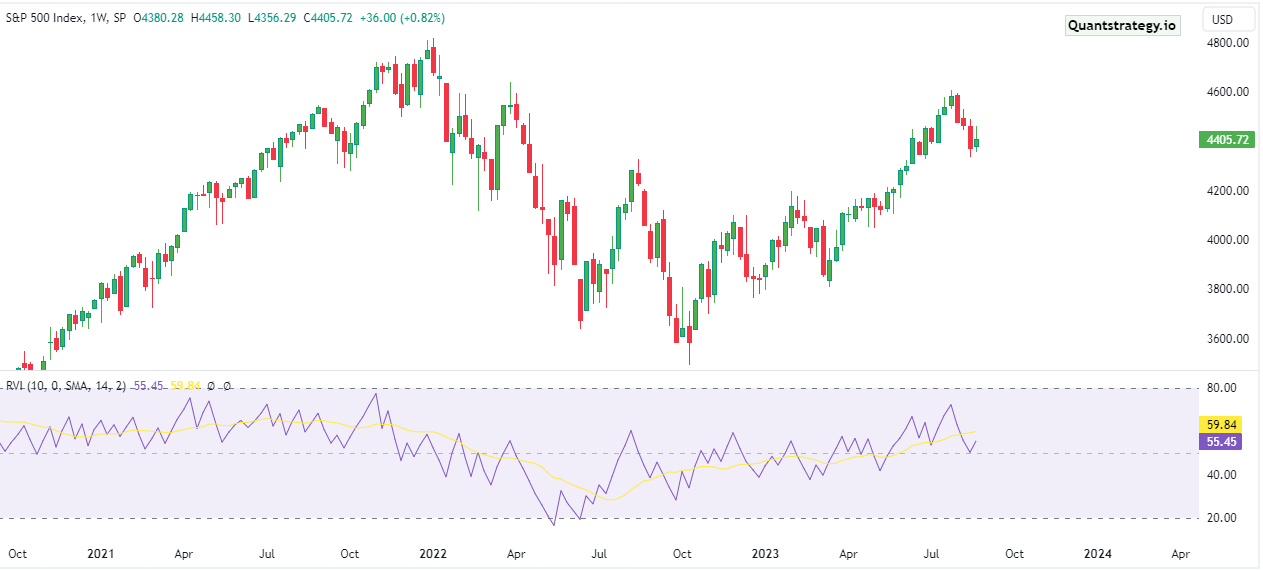
The Relative Volatility Index (RVI) is a technical indicator used in trading to assess the volatility of an asset’s price movements. It provides traders with insights into how much an asset’s price fluctuates during a specific period.
Unlike some other indicators that solely focus on whether prices are going up or down, the RVI takes a more comprehensive approach. It considers both the magnitude of price changes and the trading ranges, offering a broader perspective on market dynamics.
In essence, the RVI helps traders understand how wild or calm the market is. High volatility indicates significant price swings, while low volatility suggests more stable price movements. By analyzing this volatility, traders can make more informed decisions about when to buy, sell, or adjust their positions in the market.
Understanding Market Volatility and Its Significance
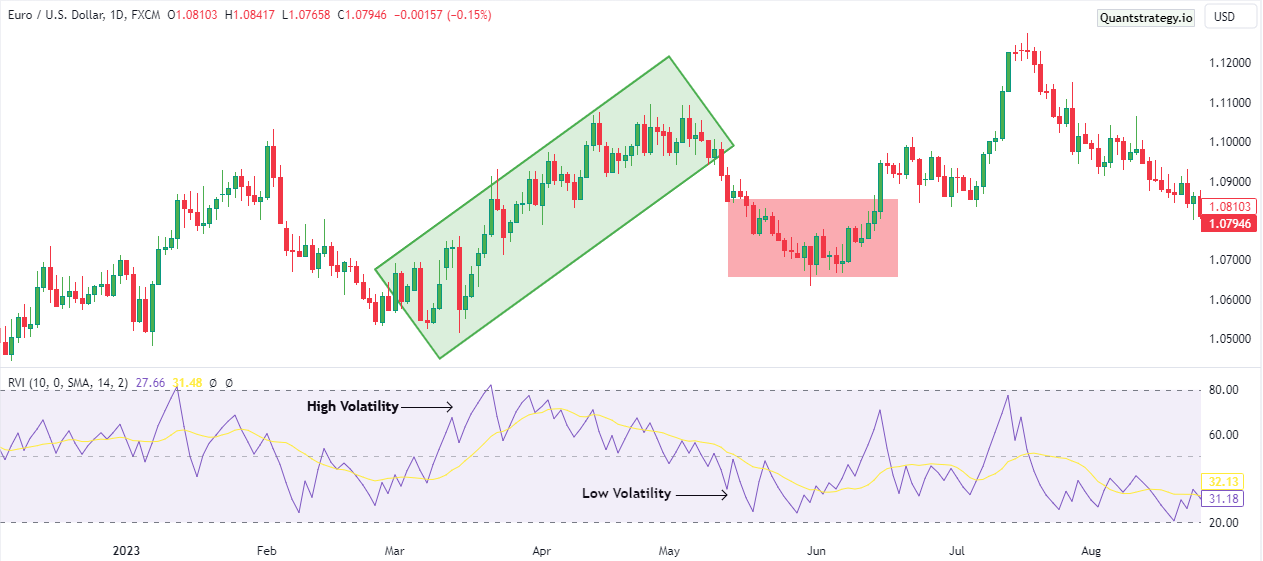
Before going into the depths of the RVI, it’s imperative to grasp the pivotal role volatility plays in trading. Volatility signifies the extent of price variation a financial instrument undergoes during a specified period.
High volatility indicates significant price swings, while low volatility hints at relatively stable price movements. Traders widely employ volatility indicators to anticipate potential shifts in the market and to recalibrate their strategies accordingly.
Calculating the Relative Volatility Index
The Relative Volatility Index (RVI) is derived through a multifaceted calculation process, incorporating both price and trading range data. The formula encompasses the calculation of average upward price movements and average downward price movements over a predefined period.
This intricate calculation yields the RVI value, typically oscillating between 0 and 100. A higher RVI reading signifies heightened volatility, whereas a lower reading implies diminished volatility.
RSI vs RVI
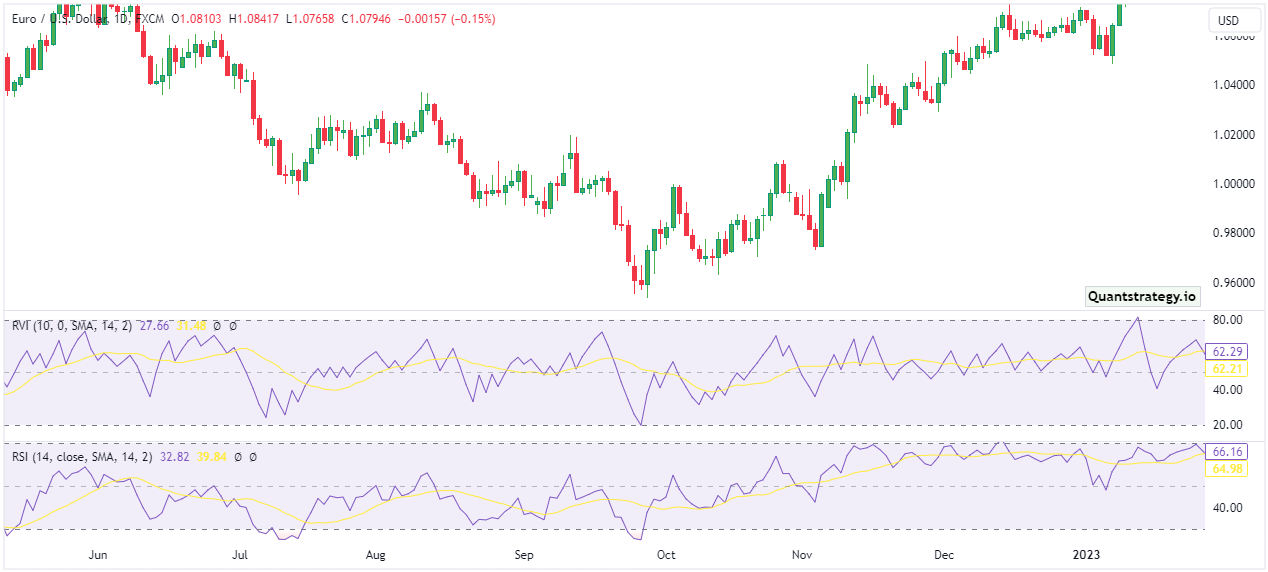
The Relative Strength Index (RSI) is a momentum oscillator that gauges the speed of price changes to identify overbought and oversold conditions, while the Relative Volatility Index (RVI) assesses market volatility through both price changes and ranges, aiding in trend identification and decision-making.
The key difference lies in their focus, with RSI centered on momentum and RVI on volatility and trends, using distinct calculation methods; however, both indicators, ranging from 0 to 100, contribute to a comprehensive understanding of market dynamics and support effective decision-making when integrated into trading strategies.
Amplifying Analytical Precision: RVI in Conjunction with Other Indicators
To paint a complete picture of market conditions, traders frequently intertwine the RVI with other technical indicators. Popular companions include Moving Averages, Stochastic RSI, and Moving Average Convergence Divergence (MACD).
RVI’s volatility insights, coupled with other tools, empower traders to make more precise and informed decisions.
Harnessing RVI for Identifying Trends in Trading
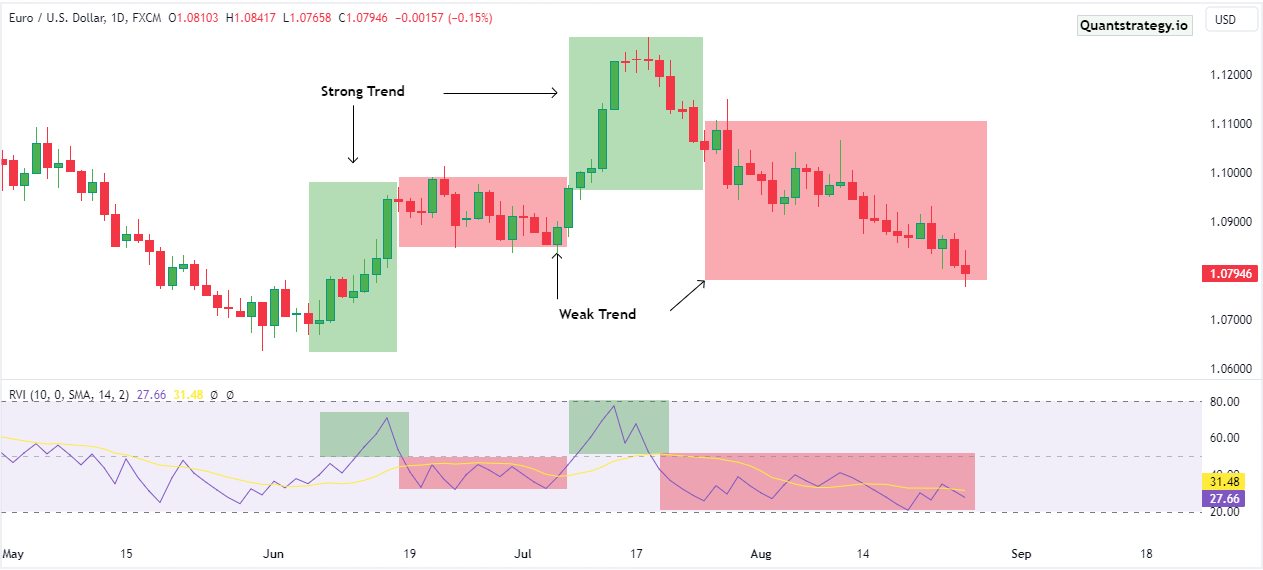
Traders often wield the RVI to discern trends. A progressively increasing RVI value signifies the strength of a trend, while a declining value might signify a weakening trend. When fused with other trend-affirming indicators, the RVI’s predictive accuracy regarding trends is substantially enhanced.
RVI Formula
The RVI is calculated in the same way as the RSI is calculated. Let’s recall the RSI formula.
RSI = 100 – 100 / 1 + Relative Strength
First, you’ll need to calculate the relative strength, by calculating first average profit and loss. This is calculated by doing the sum of gains over a certain time and dividing the total by the period. In the same way, the first average loss is calculated.
The RVI is calculated in such a way. The only difference is that it uses Standard deviation.
In summary, while both RSI and RVI are indicators used in trading, RSI primarily measures momentum and overbought/oversold conditions, while RVI assesses volatility and aids in trend identification.
Pros and Cons of Embracing the Relative Volatility Index
Pros:
- Provides a comprehensive view of volatility through price changes and ranges.
- Aids in trend identification and strategy adjustments.
- Versatile across trading markets.
- Assists in setting risk management levels.
Cons:
- Involves complex calculation.
- Effectiveness may diminish in high volatility.
- Should be used in conjunction with other indicators for complete analysis.
Mastering the Art of Effectively Utilizing RVI: Proven Tips
The Relative Volatility Index (RVI) is a powerful tool in trading, and mastering its use can significantly enhance your trading strategy. Here are some proven tips to help you make the most of RVI:
- Understand RVI Signals: Learn to interpret RVI signals, such as threshold crossings and divergences, to identify potential market shifts accurately.
- Combine with Other Indicators: Pair RVI with other technical indicators like Moving Averages, RSI, and MACD for a more comprehensive market analysis.
- Risk Management: Utilize RVI to set stop-loss and take-profit levels based on market volatility, safeguarding your investments.
- Versatility Across Markets: Recognize that RVI’s applicability extends across various trading markets, from stocks to cryptocurrencies.
By implementing these tips, you can refine your trading skills and maximize the benefits of the Relative Volatility Index in your trading endeavors.
Real-world Scenarios: Illuminating RVI’s Application
Let’s delve into a tangible scenario that exemplifies the application of the Relative Volatility Index (RVI). Imagine a scenario where a stock’s volatility is gradually diminishing.
The RVI corroborates this trend, enabling traders to fine-tune their strategy to mirror the evolving market conditions.
Navigating Common Misinterpretations and Pitfalls
While using the Relative Volatility Index (RVI), it’s important to avoid misinterpreting signals due to sudden price fluctuations and to remember that relying solely on RVI without considering other indicators might lead to incomplete insights.
A balanced approach within a comprehensive analysis strategy is key for accurate interpretation.
Conclusion
Market volatility is a fundamental aspect of financial markets. Understanding its nature and significance is essential for making informed investment decisions. While high volatility can present opportunities for traders, it also carries higher risks.
Investors and traders alike must carefully consider market volatility when formulating their strategies and managing their portfolios.
In the ever-changing world of finance, volatility remains a critical factor that cannot be overlooked.
FAQs
- Can the RVI be effectively applied to day trading?
Indeed, the RVI’s adaptability makes it suitable for various trading styles, including day trading.
- Does the RVI hold relevance for long-term investing?
While primarily tailored for short to medium-term trading, the RVI’s insights can also inform long-term investment strategies.
- Is the RVI adaptable to highly volatile markets?
Yes, the RVI’s comprehensive approach equips it to navigate different degrees of market volatility effectively.


