Guppy Multiple Moving Average, also known as GMMA, is a technical indicator used by traders to identify the direction and strength of market trends.
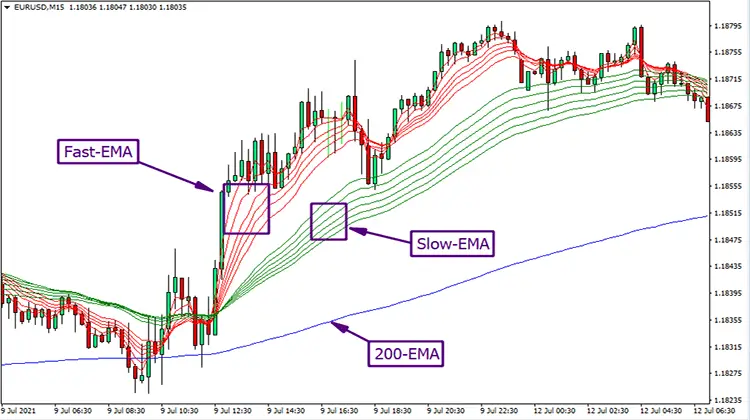
It consists of multiple exponential moving average (EMA) that are plotted on a single chart which is also called moving average ribbons.
In this article, we will discuss what GMMA indicator is, how it works, and how to use it in trading.
What is Guppy Multiple Moving Average (GMMA) Indicator?
GMMA indicator was developed by Daryl Guppy, an Australian trader and author of the book “Trend Trading”. The Guppy indicator consists of two groups of moving averages: the short-term group and the long-term group.
The short-term group is made up of 6 EMAs, whereas the long-term group consists of 6 EMAs with longer periods which identifies changing trends. This creates a total of 12 moving averages, each representing a different time period.
Short-term: The first set of moving averages have a relatively short timeframe and are used to assess short-term trading activity. The number of days used in these moving averages is usually 3, 5, 8, 10, 12, and 15.
When the short-term group crosses ABOVE the longer-term group, BUY.
When the short-term group crosses BELOW the longer-term group, SELL.
Long-term: The second set of moving averages use extended time periods and are used to assess long-term investor activity. The number of days used in these moving averages is usually 30, 35, 40, 45, 50, and 60.
The GMMA indicator is designed to identify the prevailing trend and trend strength. When the short-term EMAs are above the long-term EMAs, it indicates a bullish trend, and when the short-term EMAs are below the long-term EMAs, it indicates a bearish trend.
How does GMMA Indicator work?
GMMA indicator works by identifying the separation between the short-term group and the long-term group of moving averages. When the separation between the two groups is wide, it indicates a strong trend in the market.
Conversely, when the separation is narrow, it indicates a consolidation period or uncertainty of an average price trend strength. Here the current trend is an uptrend and as we see a crossover we can see a reversal in the the price chart.
GMMA also identifies significant trend change by looking for crossovers between the short-term and long-term groups. A bullish reversal occurs when the short-term group crosses above the long group, while a bearish reversal occurs when the short-term group crosses below the long group.
Guppy Multiple Moving Average Indicator (GMMA) Formula and Calculation
The Guppy Multiple Moving Average (GMMA) indicators is composed of two groups of exponential moving averages (EMAs). The short-term group consists of 6 EMAs with different time periods, while the long-term group consists of 6 EMAs with longer periods.
The formula for calculating each EMA is:
EMA = (Closing Price – EMA(previous)) x Multiplier + EMA(previous)
Where:
- The Closing Price is the price at which the asset closed at the end of the previous period.
- EMA(previous) is the EMA value from the previous period.
- Multiplier is the smoothing factor, which is calculated as 2/(N+1), where N is the number of periods.
To calculate the first EMA value, a simple moving average (SMA) is used for the initial value.
Once all the EMAs are calculated, they are plotted on the chart, forming a ribbon of lines. The short-term group EMAs are usually plotted in a different color than the long-term group EMAs to make them easier to distinguish.
The GMMA formula and calculation may seem complex, but with the help of trading platforms and charting software, it can be easily applied to any financial market chart. The GMMA indicator can help traders identify changing trends and make better trading decisions.
Guppy Moving Average Strategy
Traders can use GMMA indicator and Guppy moving average strategy to identify trends and trading opportunities. Here are some ways to use GMMA strategy in trading:
Identify the trend direction: When the short-term group is above the long-term group, it indicates a bullish trend, and vice versa. Trend Traders can use this information to determine the trend direction and adjust their trading strategy accordingly.
Determine trend strength: The wider the separation between the short-term mas and long-term groups, the stronger the trend, and the closer the groups, a weakening trend is. Traders can use this information to confirm the strength of the overall trend and the likelihood of its continuation.
Look for trend reversals: Crossovers between the short-term and long-term groups can indicate a potential trend reversal. Traders can use this information to identify potential buy or sell signals in new trend.
In the below picture, short-term crosses and we see a big red candle forming right after crossing breaking the support, here the price trend reversal takes place.
Use with other technical indicators: GMMA can be used in conjunction with other technical indicators, such as the Relative Strength Index (RSI) and S/R levels. This can help confirm trend direction and identify trading opportunities.
Advantages of using the GMMA Indicator
Provides a clear picture of the market trend: The GMMA uses two groups of moving averages i.e. moving average indicator to provide a clearer picture of the market trend. It helps traders identify the strength of the trend and potential trend reversals.
Helps confirm the trend: The GMMA can also be used to confirm the trend in the market. This helps traders avoid false signals and make more informed trading decisions.
Identifies potential S/R levels: The GMMA can also be used to identify potential support and resistance levels. This helps traders identify potential entry and exit points.
Easy to use: The GMMA is easy to use and can be applied to different trading instruments and timeframes.
Drawbacks of using the Guppy Multiple Moving Average
While the Guppy Multiple Moving Average indicator (GMMA) is a powerful tool for identifying trends and potential trading opportunities, there are some drawbacks to keep in mind when using this indicator.
First, as with any technical analysis tool, there is no guarantee that the GMMA will always provide accurate signals resulting as a lagging indicator. It is important to remember that the GMMA is just one of many tools that traders can use to analyze the market, and it should not be relied on exclusively.
Another drawback of the GMMA is that it can be time-consuming to set up and interpret. With 12 different moving averages to consider, it can be challenging to identify trends and determine which moving averages to use as support and resistance levels.
Additionally, the GMMA can produce false signals, particularly during periods of consolidation or when the market is moving sideways. It is important to use the GMMA in conjunction with other technical indicators and price action analysis to confirm potential trends and avoid false signals.
Finally, while the Guppy Indicator is effective for identifying longer-term trends, it may not be as useful for short-term trading. Traders who focus on short-term trades may prefer to use other technical indicators that are better suited to their trading style.
Overall, the GMMA is a powerful technical analysis tool that can be useful for identifying trends and potential trading opportunities.
However, it is important to keep in mind its limitations and drawbacks, and to use it in conjunction with other technical analysis tools to make well-informed trading decisions.
Tips for Effective Use of GMMA
While the GMMA can be a powerful tool in identifying trends and potential trend reversals, it is important to use it effectively. Here are some tips for effectively using the GMMA in your trading strategy:
Use in conjunction with other technical indicators: While the GMMA can be used as a standalone technical indicator, it is often more effective when used in conjunction with other indicators such as the Relative Strength Index (RSI) or other oscillators. This can help to confirm trend strength and potential trend reversals.
Identify support and resistance levels: The GMMA can also be used to identify key support and resistance levels. When the shorter-term group of moving averages crosses the longer-term group, this can indicate a potential trend reversal. However, it is important to look for confirmation through price action and other technical indicators.
Watch for narrow or wide separations: When the short-term and long-term groups of moving averages are tightly spaced, this can indicate a period of consolidation or range-bound trading. Conversely, when the short-term MAs and longer-term term MAs are widely separated, this can indicate a strong trend.
Guppy MMA Scalping Strategy
The Guppy Multiple Moving Average (GMMA) Scalping Strategy is a powerful and visually intuitive method designed to capitalize on short-term price movements by interpreting the underlying strength and sentiment of a trend.
Developed by Australian trader Daryl Guppy, the core of this strategy lies in using twelve exponential moving averages (EMAs), which are strategically split into two groups: a “short-term group” (often 3, 5, 8, 10, 12, and 15-period EMAs) that represents the momentum and activity of short-term traders, and a “long-term group” (such as 30, 35, 40, 45, 50, and 60-period EMAs) that reflects the prevailing trend and conviction of long-term investors.
The interaction between these two groups creates a dynamic representation of the market’s battle between immediate momentum and sustained direction, providing a scalper with a nuanced view beyond what a single moving average can offer.
For a scalper, the most critical signals occur during specific configurations of these moving average groups.
A high-probability buy signal emerges when the short-term group of EMAs consolidates tightly and then fans out aggressively to the upside, pushing above a similarly rising and well-separated long-term group.
This “expansion” indicates that short-term buyers are overwhelming both the sellers and the long-term holders, creating a strong, momentum-driven entry opportunity.
Conversely, a sell signal is generated when the short-term group compresses and then fans downward, breaking below a long-term group that is beginning to turn down and separate, signaling coordinated selling pressure.
The true genius of the GMMA indicator for scalping lies in its ability to provide clear visual cues for both entry and exit.
A scalper will enter a long trade as the short-term group expands upward, and then use the subsequent behavior of the EMAs to manage the position.
The trade remains valid as long as the short-term group remains above the long-term group and does not collapse back into it.
An exit is triggered when the short-term EMAs begin to compress, lose their upward slope, or cross back down through the long-term group, indicating that the momentary burst of momentum has exhausted itself.
By focusing on the “squeeze and expansion” of these moving average ribbons, a scalper can effectively filter out market noise and execute rapid, high-frequency trades aligned with the most powerful shifts in short-term market sentiment.
key takeaways
The GMMA indicator consists of two groups of moving averages: a short-term group and a long-term group. The short-term group includes 6 exponential moving averages (EMAs), while the long-term group includes 6 simple moving averages (SMAs).
The GMMA indicator can also be used to identify support and resistance levels, as well as potential buy and sell signals. When the short-term EMAs cross above the long-term SMAs and the separation between the two groups widens, it is a strong buy signal.
Conversely, when the short-term EMAs cross below the long-term SMAs and the separation between the two groups narrows, it is a strong sell signal.
The GMMA indicator should be used in conjunction with other technical analysis tools, such as chart patterns and the Relative Strength Index (RSI), to confirm trading signals and avoid false signals.
Traders should be aware of the risks associated with trading and use proper risk management techniques, such as setting stop-loss orders and controlling position sizes, to mitigate potential losses.
Conclusion
In conclusion, the Guppy Multiple Moving Average (GMMA) is a highly effective tool for traders looking to identify trends and trading opportunities in the financial markets. It uses a combination of short-term and long-term moving averages to identify changes in trend direction, trend strength, and support and resistance levels.
When using the GMMA, it is important to keep in mind that it is just one tool in a trader’s arsenal and should be used in conjunction with other technical indicators and chart patterns to confirm potential trading opportunities.
Traders should also be aware of the risks involved in trading and always use proper risk management strategies to protect their capital.
By mastering the GMMA, traders can gain a deeper understanding of the market trends and make more informed trading decisions.
Indicator Backtest Library
Our platform provides professionally backtested results on the trading indicators you already use.
Want to see a concrete example? We analyzed a classic EMA strategy against the SPY to give you a clear picture of its historical performance, including risk and return metrics.
No fluff, just actionable insights on 6000 US stocks and ETFs. See the verified performance data now and make your next trade with confidence.