Moving Average Envelopes are a powerful technical analysis tool designed to overcome the common weaknesses of standard Moving Averages (MAs), particularly their tendency to produce false signals or “whipsaws” in volatile and choppy markets. While Moving Averages provide unrivaled insights into price momentum, deceptive trend reversal signals can lead even experienced traders into traps, resulting in missed opportunities or unnecessary losses. The Moving Average Envelope solves this by creating a dynamic channel: it enhances the base MA by plotting upper and lower bands a set percentage above and below the moving average. Also referred to as Moving Average Bands or Percentage Envelopes, this indicator helps traders filter out market noise, identify genuine trend movements, and quickly spot potential overbought and oversold conditions. This comprehensive guide will detail the mechanics of Moving Average Envelopes, explore their diverse applications across various markets and strategies, and show you exactly how to leverage this crucial analytical tool to significantly refine your trading strategy and make more informed, profitable decisions.
What are Moving Average Envelopes?
Moving Average Envelopes represent a technical analysis indicator, which consists of two lines – one above a moving average and one below it. The moving average can depend on the opening, closing, highs, or lows, deploying either simple or exponential moving averages. Each envelope can then be adjusted to the same percentage, either above or below the moving average, where these visual lines form parallel bands that follow the price action.
The indicator shares similarities with several technical indicators like Bollinger Bands and Keltner Channels, except that these two may adjust the width of the channels or bands based on volatility measures.
The current price usually stays within the envelope unless these envelopes are positioned near the moving average. The way traders utilize moving average envelopes for making buying and selling choices can vary greatly. Moving average envelopes, in general, assist traders in confirming trends and identifying overbought and oversold positions (providing potential entry and exit points).
Some think that a stock price passing above the upper envelope signifies a signal of strength, implying that further signaling is possible. On the other hand, others believe it could suggest that the stock is overbought, which is a sign of weakness.

The indicator consists of two components: a moving average and upper and lower envelopes. A percentage defines the distance between the two envelopes and the moving average.
Besides, the term “envelope” refers to how those bands encircle the original moving average line. The starting point is the exponential N-period MA. It’s calculated as the average stock price for each of the past N periods.
Traders consider the upper envelope a resistance line and the lower envelope a support line. They search for buying opportunities when the price falls into the lower envelope and selling opportunities when the price falls into the upper envelope.
How to Calculate a Moving Average Envelope?
Calculating a moving average envelope is pretty simple. First, it is important to determine the type of moving average that you would use. There are several types of moving averages. Most popular are a simple moving average (SMA) and an exponential moving average (EMA).
Remember, an exponential moving average provides more recent information than a simple moving average. As a result, it responds faster than the simple moving average. However, you will be prone to fake-outs because of the extreme sensitivity.
Regardless of the MA being used, set the exact number of periods that you want to apply. After that, set the percentage value for the envelopes.
For example, a 10-day SMA with a 10 percent envelope will demonstrate the lines as follows:
Upper Envelope: 10-day SMA + (10-day SMA x 0.1)
Lower Envelope: 10-Day SMA – (10-day SMA x 0.1)
How to Use Moving Average Envelopes
Using Moving Average Envelopes is relatively simple. First, pick a chart that is trending in either direction. It should not be used when the asset price moves sideways.
After that, enter the period you intend to use. Most platforms have a default period of 14 days. You must also specify the deviation to be used. Most platforms set the default to 10%.
Below is a good example of moving average envelopes. The 14-day moving average is shown in red.

As shown above, when the price moves beyond the yellow upper band, it usually indicates that the price will continue to rise. The same thing happens When the price crosses the lower envelope.
Using the Moving Average Envelope to Confirm Trends
In a Moving Average Envelope, a moving average is in between two lines (envelopes). So, it is an indicator that follows the market trend.
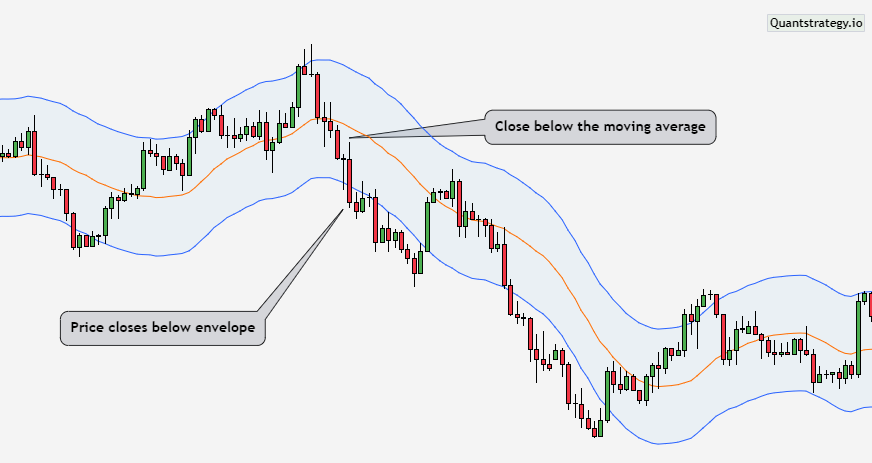
When the price closes over the upper band, it is considered a buy signal. When the price closes under the lower band, it is a sell signal.
Using the Moving Average Envelope to Determine Overbought and Oversold Conditions
We know that upper and lower envelopes can behave as dynamic support and resistance levels. The same laws that regulate ordinary levels of support and resistance apply here.
They are referred to as dynamic because they’re not static. When the price hits the upper envelope and reverses, the asset is overbought. This behavior typically indicates a sell signal.
When the price resists the lower envelope, the asset is considered oversold, signaling a buy signal.
However, it is critical to remember that oversold and overbought conditions can persist when a trend is strong.

As can be seen above, the price resists the lower band, indicating that it is oversold. Oversold conditions indicate that a buy reversal is possible soon. As a result, a buy order is placed here.
Moving Average Envelopes Trading Strategy
Envelopes can be utilized as bands encircling price movements that indicate overbought and oversold levels as well as price targets. Many traders perceive Envelopes as a variant of Bollinger Bands. The underlying premise of both indicators is the same: the price will always return to the primary trend after any fluctuations.
A bullish trend will be confirmed by an upward direction of the envelopes, whereas a bearish trend will be shown by a downward slope. By examining the price and envelope bands, traders can spot indications for the probable emergence of a new trend or shifts in trend direction.
A variety of trading strategies can be creabased ons of the envelope indicator.
Examine the chart and be on the lookout for when the price touches or crosses the upper or lower band. When the price reaches the upper line, it is a sell signal; when the price hits the lower line, it is a buy signal. Consider the XAUUSD chart below:

This is a buy structure because the price reached the lower envelope and was rejected. You can it buy if the candle closes nearer the high.

The preceding chart illustrates a possible sell signal as the price reached the upper envelope and the candle closed toward the low.
However, envelopes frequently produce misleading or incredibly late trading signals. As a result, it is advantageous if the signal is verified using additional technical analysis indicators, market sentiment, fundamentals, price action, and so on.
Setting a stop-loss and take-profit
You might employ the closest support and resistance levels to determine probable stop-loss and take-profit levels. If the swing area (stop-loss zone) is excessively far away, you should avoid trading because it will harm the risk-reward ratio.
Drawbacks of Moving Average Envelopes
Users face various challenges when employing Moving Average Envelopes. First, the indicator is nearly impossible to utilize in ranging markets. It will not provide any positive signals during this time period.
Second, envelopes could trigger false signals in the market. For instance, you may think that buy signals are generated when the prices move over the middle line, only for a reversal to occur.
Conclusion
Moving average envelopes are a great tool for determining the formation of a trend. Envelopes can also be useful for identifying turning points in short-term trends with a high probability. The Moving Average Envelope dramatically enhances trading outcomes. Erroneous signals are reduced as entry rules are strengthened. It validates trends and provides details concerning overbought and oversold conditions. All of these things, taken together, will bring you closer to steadiness in the currency market. Moreover, traders and investors in any financial market can effectively employ this technical instrument with the necessary competence and experience.
<2>Pre-Built Backtest Library
Instant Backtests
At QuantStrategy, we believe in validation through data.
That’s why we’ve built a library of backtests on foundational tools like the industry standard indicators.
Curious about the specific win rate, maximum drawdown, and overall performance of strategies on the 6000+ stocks?
We’ve done the heavy lifting.
Click here to explore the full backtest report and turn your market curiosity into a strategic edge.