

In the intricate landscape of financial markets, mastering the art of trading requires a nuanced understanding of various indicators. Among these, the(BOP) Balance of Power indicator stands out as a powerful tool for traders seeking to navigate the complexities of market dynamics.
Let’s delve into the intricacies of this technical indicator, uncovering its potential to generate valuable buying and selling signals.
Decoding Unleveraged Buying Power with the Balance of Power Indicator
The Balance of Power indicator is a crucial element in technical analysis, providing insights into the relative strength of buyers and sellers. Developed by Igor Livshin, this indicator helps traders assess the distribution of power and potential shifts in market sentiment, and understand price movements.
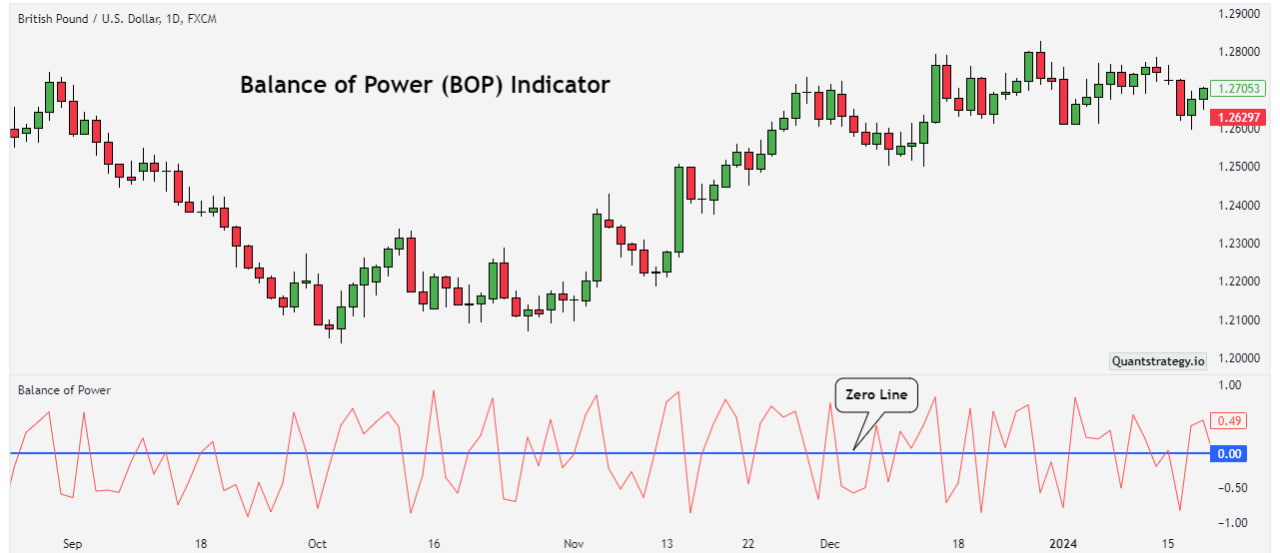
Operating around the zero line, this indicator measures the buying and selling pressure in the market, offering traders signals and a comprehensive view of market sentiment.
Understanding the Zero Line and Crossovers
The zero line in the Balance of Power indicator serves as a pivotal reference point. Positive values above the zero line indicate dominance of buying pressure, while negative values below signify the prevalence of selling pressure. Zero-line crossovers become particularly significant, acting as potential indicators for trend reversals.
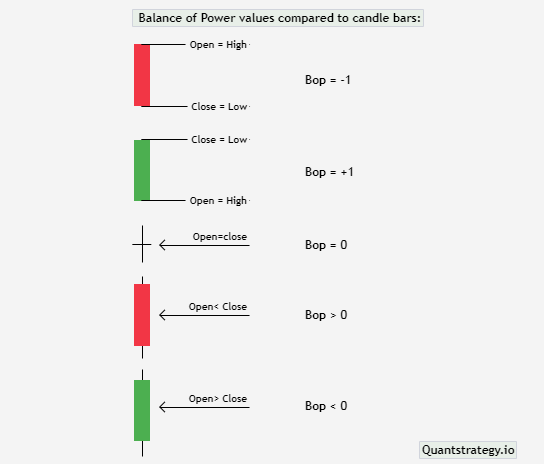
The magnitude of the BOP values also contributes to the understanding of the market dynamics. The rising bop line indicates a stronger buying pressure, while the falling bop line suggests a more pronounced selling pressure. Traders often pay attention to the trend and magnitude of the BOP oscillation to anticipate potential changes in market direction.
BOP values compared to candle bars:
Utilizing the Power Indicator Strategy
Traders often integrate the Balance of Power indicator into their strategies to generate buy and sell signals. The strategy involves interpreting the rising and falling BOP lines alongside momentum indicators, aiding in trend identification.
However, caution is advised, as the indicator may generate false signals, necessitating a holistic approach to analysis.
1. Integration with Moving Average:
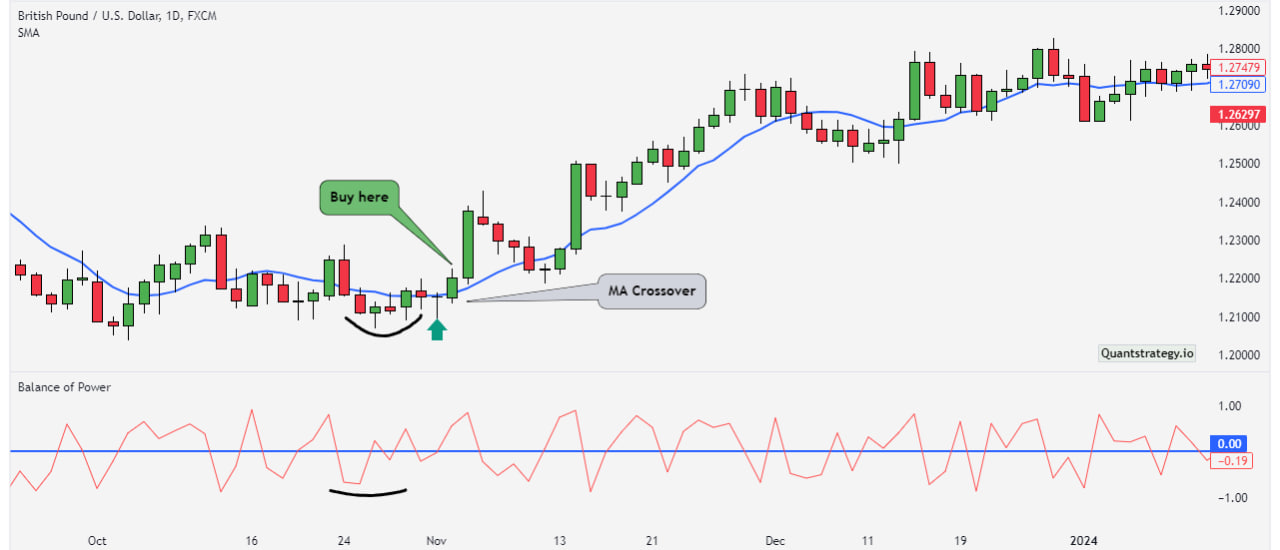
- Traders often integrate the BOP indicator with the moving average to enhance its effectiveness. By observing the BOP in conjunction with indicators such as the simple moving average, and price-based indicator, traders gain a more nuanced understanding of the prevailing trend and potential reversal points.
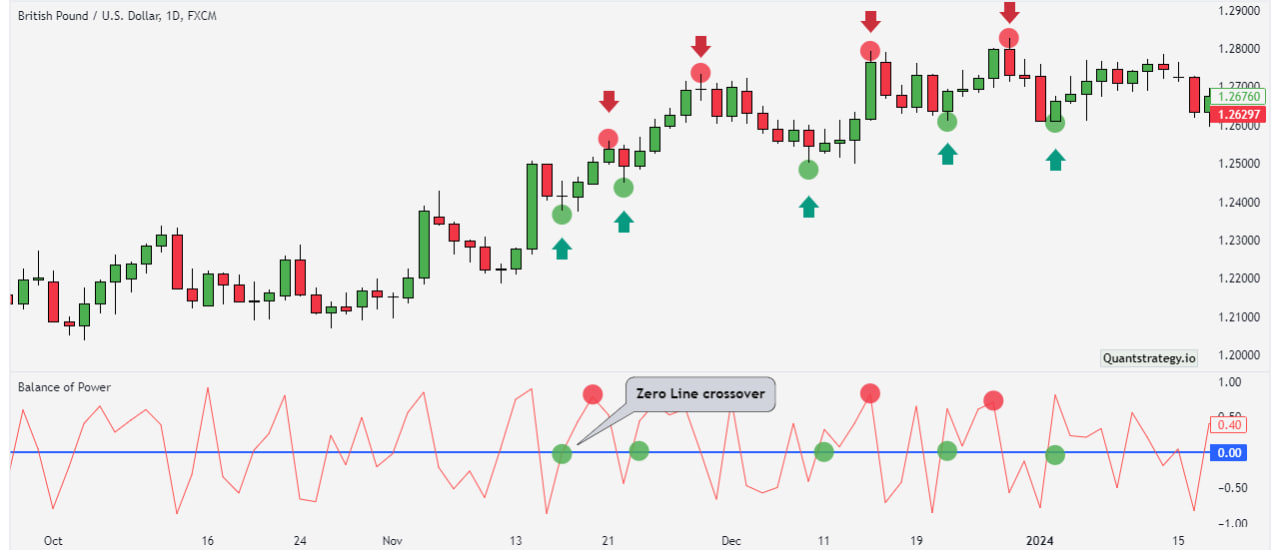
2. Zero Line Crossover:
- Zero-line crossovers are pivotal signals in this strategy. When the BOP crosses above the zero-level line, it indicates a potential shift towards a bullish market sentiment, suggesting a favorable environment for buying. Conversely, a crossover below the zero line signals a potential bearish sentiment, prompting traders to consider selling opportunities.
3. Trend Reversals and Continuations:
- Traders utilize the power indicator measures and pay close attention to the BOP’s ability to signal trend reversals or continuations. By analyzing the direction and magnitude of BOP oscillations, traders can make informed decisions on whether the current trend is likely to persist in the same direction or undergo a reversal.
4. Guarding Against False Signals:
- The strategy acknowledges the possibility of false signals, especially during periods of low volatility. Traders exercise caution and cross-verify BOP oscillates with additional analyses to ensure a more accurate representation of market conditions.
Overbought and oversold zones
By assigning specific numerical values, such as 0.5 for overbought and -0.5 for oversold levels, traders can precisely pinpoint potential turning points in market dynamics. Simply draw a Horizontal line at any point on the 0.5 level in the indicator. Enter “Alt+H” and repeat the process to drop another horizontal line on the -0.5 level to mark overbought and oversold zones respectively.
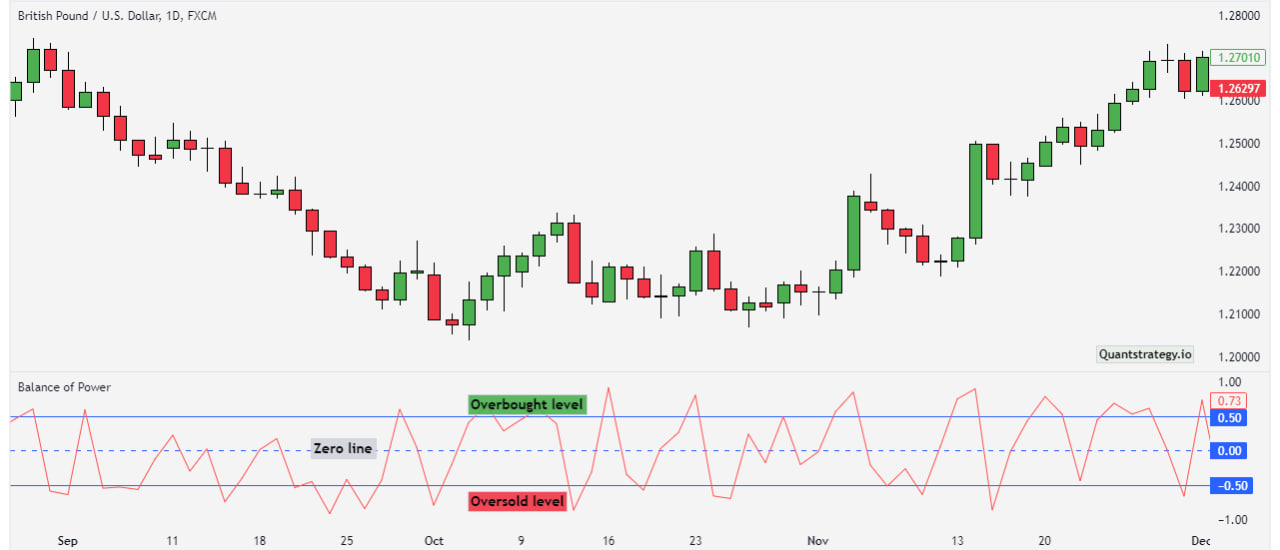
1. Overbought Zones
When the BOP indicator registers large positive values surpassing the designated 0.5 threshold, it signifies an overbought zone. This signals an excess of buying pressure, suggesting a potential trend reversal or correction in the asset’s price. Traders interpret this as a cautionary signal to consider implementing sell strategies.
2. Oversold Zones
Conversely, when the BOP indicator produces large negative values below the specified -0.5 level, it indicates an oversold zone. This points to an abundance of strong selling pressure, potentially leading to an artificially low asset price. Traders view this as a potential buying opportunity, anticipating a corrective upward movement in the market.
Strive for a Holistic Approach:
Recognizing the value of numerical thresholds, traders are encouraged to adopt a holistic approach, combining insights from BOP with other technical indicators for a comprehensive understanding of market dynamics.
Combining with Other Indicators
To bolster its effectiveness, traders often combine the Balance of Power indicator with other technical analysis tools. Other trading strategies like pairing it with moving averages or trendlines can provide a more comprehensive view of market dynamics, aiding in the identification of potential entry and exit points.
Navigating Zero Center Line and Divergences
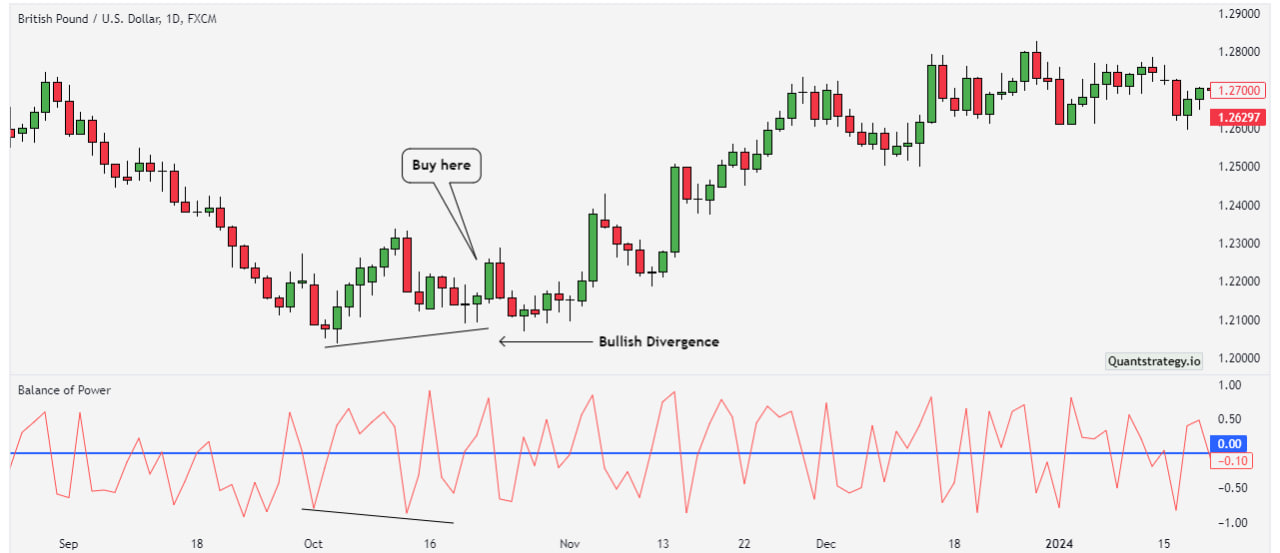
The center line is a crucial aspect of the Balance of Power indicator. Crossing above or below this line can signal shifts in market power. Both positive divergence and negative divergence, between price movements and BOP readings, offer further insights into potential trend reversals or continuations.
Enhancing Trading Decisions with the BOP Indicator
Most traders leverage its insights to identify trends, determine overbought and oversold levels, and assess the strength of buying or selling pressure. The indicator’s ability to measure buying power over a specified time period enhances its relevance in decision-making.
Calculation of the BOP
The calculation of the Balance of Power is straightforward. It is derived by subtracting the closing price from the opening price and dividing the result by the high-low range. Here is the following formula:
BOP=(Close−Open)/ (High−Low)
This calculation results in a value that indicates whether buyers or sellers dominate, which is the main signal.
Interpreting Balance of Power Readings
A positive BOP suggests that buyers are in control, while a negative reading indicates dominance by sellers. Traders pay attention to the trend and magnitude of BOP readings, as significant shifts can foreshadow potential changes in market direction.
Avoiding Pitfalls
While the Balance of Power indicator is a valuable ally, traders must be mindful of potential pitfalls. False signals can occur, especially during periods of low volatility.
Additionally, the indicator, with its fairly complex calculations, is most effective when used in conjunction with other technical indicators and analyses.
What Are the Limitations of BOP Indicators?
The Balance of Power (BOP) indicator, though valuable in technical analysis, has limitations that traders should be mindful of.
It is sensitive to price movements, making it susceptible to fluctuations and false signals, especially in volatile markets. Relying solely on BOP for trading decisions is not advised; combining it with other indicators enhances accuracy.
Identifying extreme levels and interpreting BOP readings in sideways markets can be challenging. The lack of context and complexity may pose difficulties for novice traders.
BOP relies on historical price data, which may not always accurately represent future market movements. Traders should recognize that past performance does not guarantee future results, and market conditions can change unpredictably.
Additionally, the potential for false signals, subjectivity in interpretation, and historical data bias are factors traders should consider.
Conclusion
The Balance of Power indicator emerges as a potent tool in the arsenal of traders navigating the financial market. Its ability to measure buying and selling pressure, identify trends, and signal potential shifts in market dynamics makes it a valuable asset.
However, it is essential for traders to grasp its nuances, interpret its readings within the context of other indicators, and approach trading decisions with a holistic mindset.
FAQs
How does the Balance of Power indicator measure buying and selling pressure?
The BOP indicator operates around the zero line, with positive values indicating buying pressure and negative values signaling selling pressure.
Can the Balance of Power indicator generate false signals?
Yes, traders should be cautious, as the indicator may produce false signals, especially during periods of low volatility.
Can we use this indicator on other trading platforms?
Yes, the Balance of Power (BOP) indicator is versatile and can be utilized in various trading platforms, including MetaTrader 4 (MT4).
How can traders utilize the BOP indicator in trend identification?
Traders interpret rising and falling BOP lines alongside moving averages to identify trends and potential reversals.
Is the Balance of Power indicator suitable for novice traders?
While powerful, novice traders should familiarize themselves with its complexities and use it in conjunction with other technical indicators for a comprehensive approach.


