Created by Roger Altman and introduced in the Technical Analysis of Stocks & Commodities journal in 1993, the Relative Momentum Index (RMI) is a variation of the Relative Strength Index (RSI). It was developed to improve the classic RSI indicator readings when the price hits the territories of overbought/oversold levels.
What is the Relative Momentum Index (RMI)?
The Relative Momentum Index measures the ratio of upward changes versus downward changes in a price over a given number of bars. The main difference between RSI and RMI is that the Relative Strength Index (RSI) measures the upward downward movement ratio for a single bar, while the Relative Momentum index (RMI) measures it for several bars.
Similar to RSI, the values of the Relative Momentum Index range between 0 and 100, where 30 and 70 levels indicate oversold and overbought conditions of the market, respectively.
Since RMI closely resembles RSI, the two indicators are analyzed and interpreted the same way. With the Relative Momentum Index, you may search for buying possibilities when the price approaches the 30 level and selling possibilities when the indicator value is near the 70 level. Similarly, an RMI reading above 50 is regarded as bullish, while a reading below 50 is considered bearish.
The RMI indicator is a very useful technical analysis tool for determining the overall market trend and buying/selling opportunities.
Relative Momentum Index Formula
RMI = 100 – 100 x ( 1 / [ 1 + up / down] )
Where:
up = sum of positive changes for given n bars,
down = the sum of negative changes for given n bars.
How to Use the Relative Momentum Index in Trading
The Relative Momentum Index, like many overbought/oversold indicators, has comparable strengths and disadvantages. The RMI will stay at overbought or oversold levels for quite a while in strong trending markets. The RMI tends to swing consistently between an overbought territory ranging from 70 to 90 and an oversold range of 10 to 30 in non-trending markets. When the RSI deviates from the price, the price will finally revert to the index’s direction.
The RMI indicator, as a traditional indicator of technical analysis, helps you to assess the following trade possibilities:
Peaks & Troughs
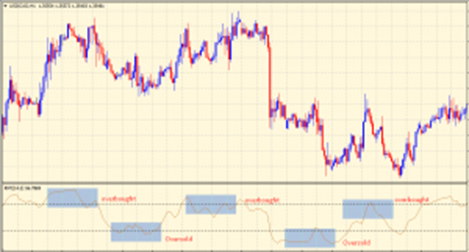
When RMI hits and passes the level of 70 during an uptrend, it is a strong indication that the price won’t be able to carry on the uptrend. In this scenario, the RMI indicator strongly suggests the overbought zone and a collapse might commence as soon as the price reaches this level.
If the indicator hits and passes the level of 30 during a downtrend, this is the key indication that the price has completed a correction and is now free to move upward. In such a case, an asset can be purchased.
Price Trends
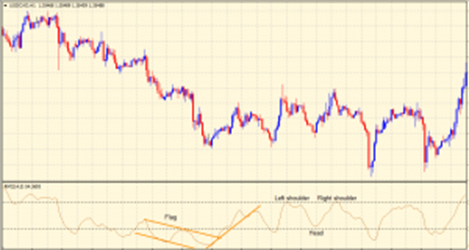
The Relative Momentum Index can also provide price action signals, including flags, triangles, and a head and shoulders” pattern, which a trader can use even if the model hasn’t yet appeared on the price chart.
Convergence/Divergence
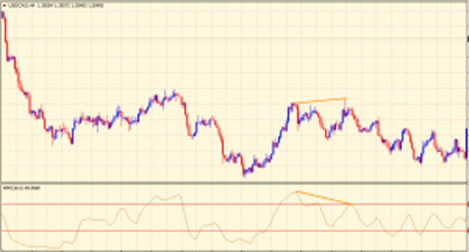
The Relative Momentum Index, as an oscillator, enables you to examine divergence/convergence signs on the indicator line about price movements. These type of signals on the Relative Momentum Index are the most significant for decision-making since it provides an early indication of a reversal and can suggest an imminent trade entry.
RMI Trading Strategy
By now, we know that the RMI is assessed like the RSI indicator in technical analysis. A basic trading system built on the RMI indicator would indicate a buy signal when RMI values rise above 30 after falling below it and a sell signal when RMI values fall below 70 after rising above it.
Because RMI values over 50 are regarded bullish, and values below 50 are considered bearish, certain traders can opt to construct signals based on RMI and 50 center line crossovers: sell when RMI falls below 50 and buy when RMI rises above 50.
The third technique to use the RMI is to apply Exponential MA to the RMI and use it as a signal line. The RMI indicator in this technique consists of two lines – the RMI itself and the Signal Line (EMA added to the RMI). The signals are produced at the RMI and its Signal Line crossovers: sell when the RMI falls below its Signal Line and purchase when the RMI rises above its Signal Line.
Let us discuss a simple trading technique centered on the overbought and oversold levels.
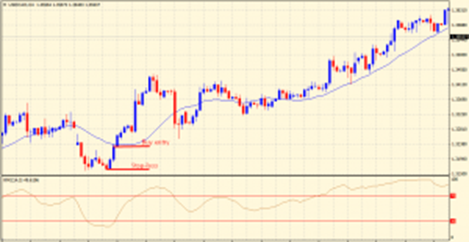
Buy Strategy with RMI
- The RSI value should hit 30 (oversold zone).
- The price must be above the 20-period simple moving average.
- Watch for the bullish candle to emerge before entry.
- Place a stop loss close to the swing low.
- Exit the trade once the price hits 70 (overbought zone).
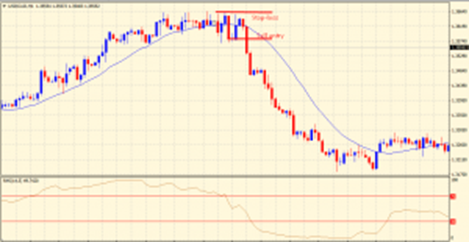
Sell Strategy with RMI
- The RSI value must touch the 70 level (overbought zone).
- The price must be under the 20-period simple moving average.
- Watch for the bearish candle to emerge before entry.
- Place a stop loss close to the swing high.
- Exit the trade once the price hits 30 (oversold conditions).
Conclusion
Roger Altman’s Relative Momentum Index attempts to improve the original RSI readings by adding a component of momentum to RSI. The key difference between them is the time frame during which the average gains and losses are analyzed. Instead of comparing 1-day gains and losses, RMI uses a change of closing price between the current bar and N bars. Although the RMI indicator is very useful in trading, technical analysts and skilled traders always recommend utilizing it in conjunction with other useful technical analysis tools to maximize profits. It is also critical to prevent false trading signals.


