
Candlesticks patterns are a popular charting technique used by traders to anticipate the direction of price movement. They offer plenty of insight into previous market movements as well as prospective price movements. Some traders use them as signals for trade entry and exit points. The shooting star candlestick pattern is just one more method of displaying information about an asset’s price movement.
The shooting star pattern is a bearish candlestick pattern that can be traded independently. It is a part of the ‘hammer’ group and is quite similar to the inverted hammer pattern.
In this article, we shall learn its key characteristics along with how to trade shooting star candlestick patterns for success.
What is Shooting Star Candlestick Pattern?
A shooting star pattern is a bearish reversal candlestick pattern that consists of just one candle. It occurs when an asset’s price is significantly pushed higher but then gets rejected and closes near the opening price again. This leaves behind a long upper wick, a small body, and a small lower wick.
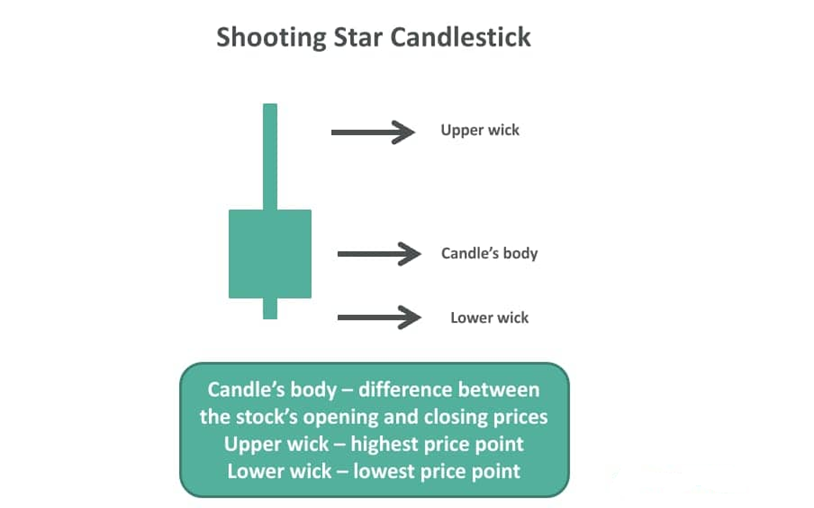
For a candlestick to qualify as a shooting star, the long upper wick must occupy at least half the length of the candlestick. There must be little to no shadow beneath the actual body. Moreover, it must show up at the peak of an upward trend. For this reason, the shooting star candlestick pattern is frequently considered to be a possible indicator of a bearish reversal. This suggests that an uptrend may not continue, and can lead to price decline. As a result, traders should get ready to take a sell position once this candle pattern is recognized.
Traders need to distinguish between the shooting star pattern and the inverted hammer candlestick pattern. They both feature a small body and a longer upper wick. The inverted hammer, however, denotes a bullish reversal as opposed to a bearish one. Moreover, the inverted hammer is frequently observed at the bottom of a downtrend, and the shooting star, on the other hand, forms at the end of a bullish trend and is essentially a top reversal pattern.
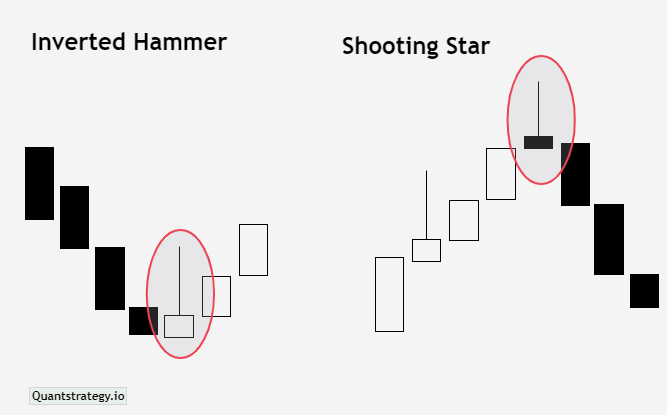
The shooting star pattern occurs when the open, low, and close are nearly the same price. Additionally, there is a long upper shadow, which is usually described as at least twice as long as the real shooting star’s body.
What do Shooting Star Patterns Tell?
A price top and reversal may be imminent, according to shooting star candlestick patterns. The best performance for this candle pattern occurs when it follows a run of three or more ascending candles with greater highs. Additionally, even if a few recent candles were bearish, it can occur when prices were generally rising.
A candlestick shooting star occurs after the price advance and rises steadily all day. This exhibits the same buying pressure as in earlier periods. The day’s gains are, however, erased when the sellers step in and push the price back down closer to the open. This indicates that sellers may be taking control as purchasers lost power toward the conclusion of the day.
The customers who made purchases during the day but are now in a losing position since the price has dropped back to the open are represented by the long upper shadow.
The candle that appears after the shooting star is what confirms the shooting star reversal pattern. The next candle must have a high that is lower than the high of the shooting star candlestick pattern and a close that is lower than the shooting star candlestick’s close. Idealistically, the candle that comes after the shooting star should open near the previous close or with a downward gap before descending sharply on high volume. A negative day after a shooting star candlestick pattern indicates a price reversal and raises the possibility of a further price drop. Traders could attempt to sell or short-sell.
If the price rises following the shooting star, the price range may still act as resistance. For example, the price may stabilize close to the shooting star. The uptrend will still be present if the price eventually rises, so traders should favor long positions over short or sell positions.
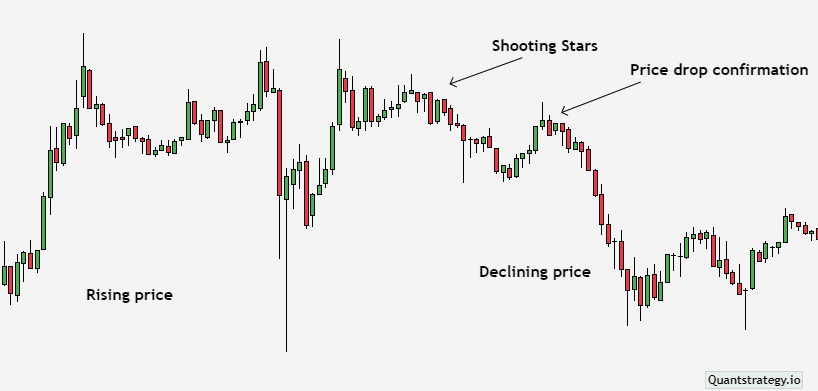
As mentioned above, the shooting star pattern is a bearish reversal pattern that can be traded as an independent pattern.
Let us see how the shooting star candle pattern can be traded on the H4 EURUSD chart.
Entry Point
The existence of a well-established uptrend and the clear market dominance of bulls should be the two most significant conditions. The trader can quickly confirm this and recognize it, but to be more explicit, there must be at least three bull candles in the uptrend before the shooting star candle forms.
It’s crucial to identify support and resistance when performing technical analysis on any asset. This accounts for 80% of the transaction’s success.
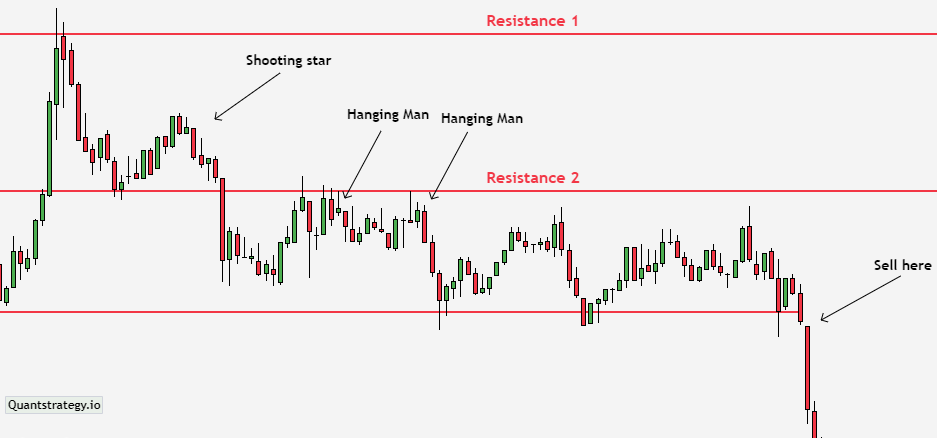
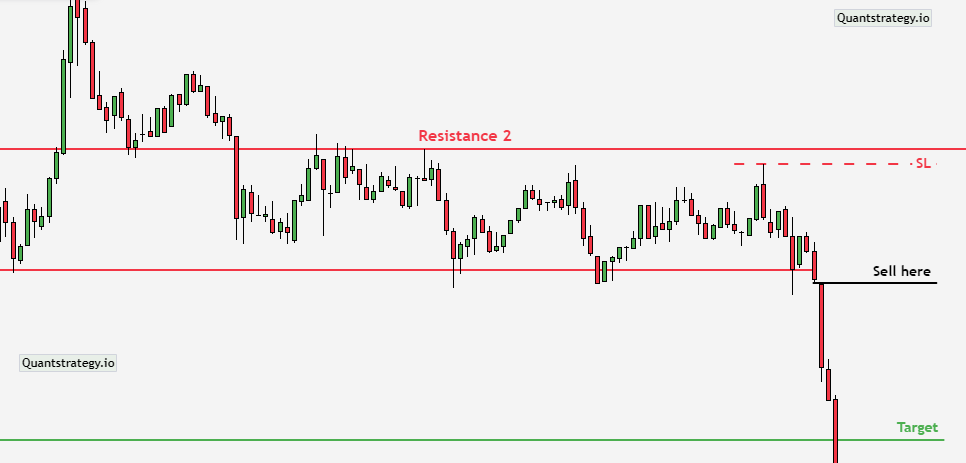
According to the chart, the price has been trying for a long time to break out of a long-term consolidation under the resistance. With each effort, the bulls, however, became weaker, and the bears became more powerful. This is demonstrated by the emergence of several bearish patterns, such as reversal patterns like the hanging man, shooting star pattern, and marubozu.
To confirm that the price has reversed and sellers are in control of the asset, it is crucial to wait for the breakout of support (blue line) and retest it during conservative trading. It is possible to start a short trade below this level.
A riskier trading strategy may allow you to open trades even higher, in the area where shooting stars and hanging man form.
Stop Loss
It’s crucial to set a stop loss after performing technical analysis and starting a short trade. By using this order, traders can reduce their financial losses. The stop-loss (red dotted line) must be set 500 basis points above the position opening or above the broken-output support level in accordance with risk management guidelines.
Take Profit
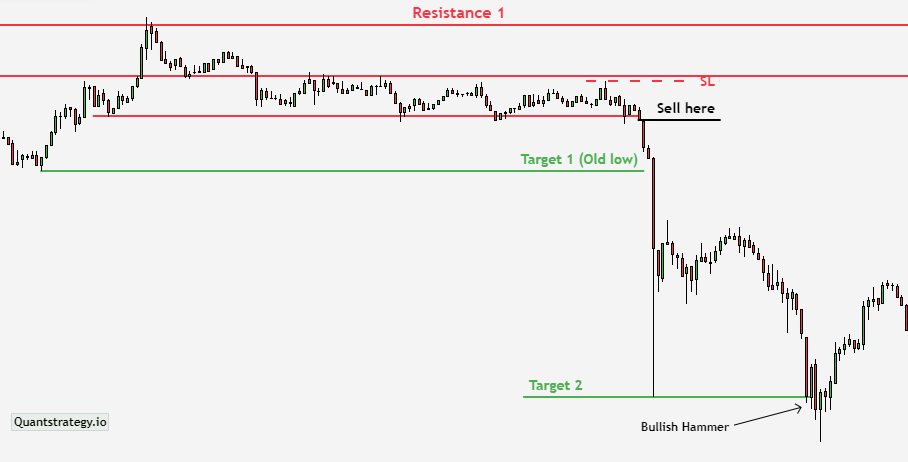
When the price reaches the support level, it’s imperative to take a profit. The chart indicates that following the impulsive downward movement, the price reached support. This level marked the onset of bullish engulfing and hammer reversal patterns.
Conclusion
The shooting star formation is an important pattern in candlestick analysis. It alerts traders to the impending possibility of an uptrend reversal. Trading the shooting star enables traders to profit during short-term trading.
However, it is preferable to use it in combination with other indicators or patterns like price trends, momentum, and volume indicators in order to reduce the risk. It gives you a safety net in case the market doesn’t move in the expected way.
The quality of trading and possible profit relies on competent analysis, accurate trend identification, and market participant psychology.


