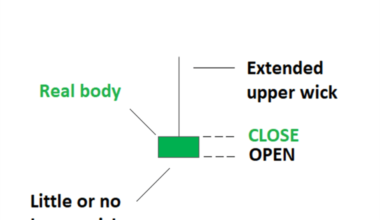
TTechnical Indicators Read More 5 minute read The Inverted Hammer Candlestick Pattern: How to TradebyQuantStrategy.io TeamFebruary 19, 2024 Also referred to as the inverse hammer, the inverted hammer candlesticks are known for bullish reversal candlestick formation.…
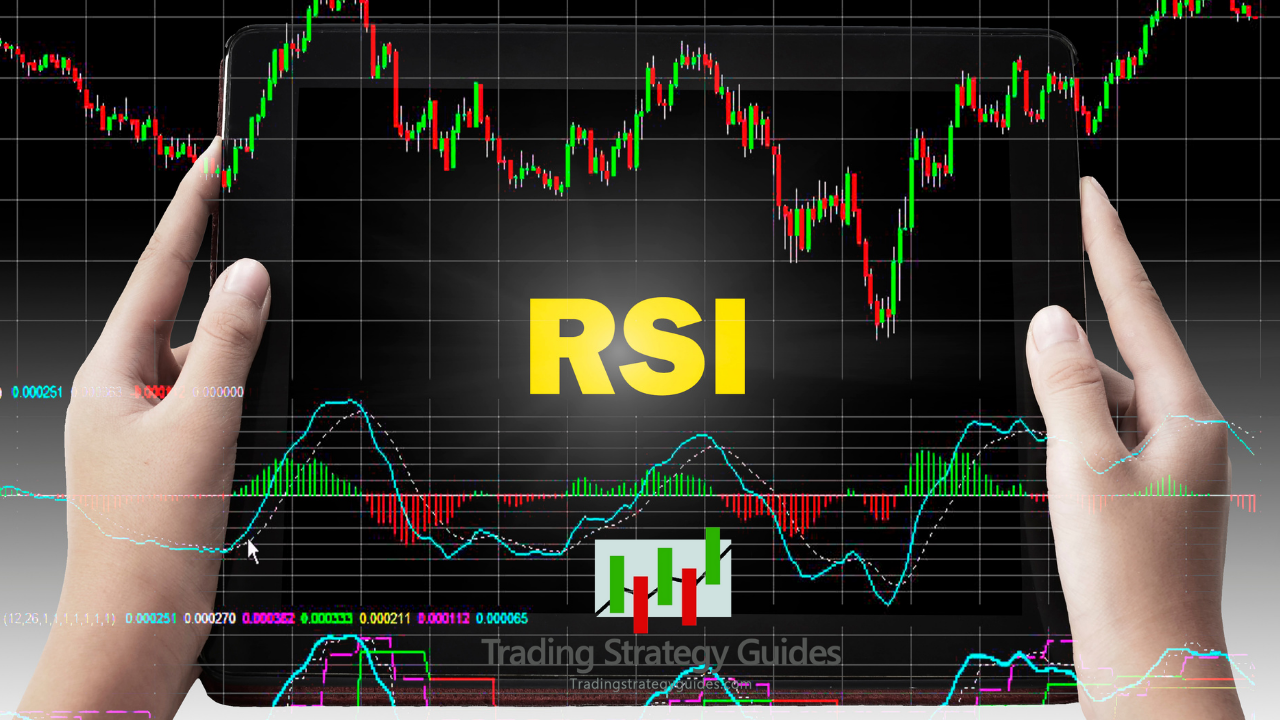
TTrading Strategies Read More 10 minute read RSI Trading Strategies: How to use Relative Strength IndexbyQuantStrategy.io TeamFebruary 19, 2024 RSI or Relative Strength Index is a momentum indicator developed by J. Welles Wilder and explained it in…
TTrading Strategies Read More 6 minute read How to Use Fibonacci Retracements in Trading Strategies?byQuantStrategy.io TeamFebruary 19, 2024 While there are numerous technical indicators available in the financial market, Fibonacci retracements have emerged as one of…
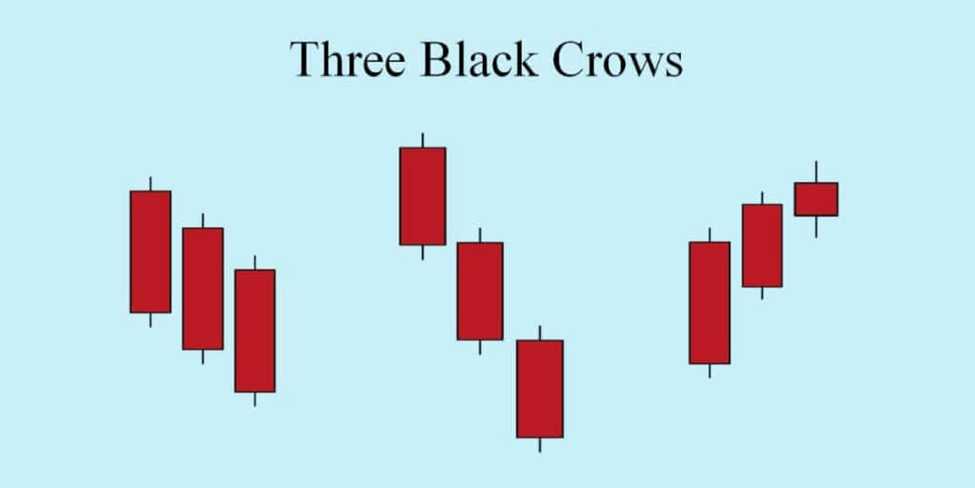
TTrading Strategies Read More 5 minute read Understanding the Three Black Crows Candlestick Pattern for Successful TradingbyQuantStrategy.io TeamFebruary 18, 2024 In stock markets, we can rely on a bunch of ways to spot a trend reversal. Candlestick patterns…
TTrading Strategies Read More 5 minute read How to Trade the Rounding Bottom Chart PatternbyQuantStrategy.io TeamFebruary 18, 2024 Finding patterns that indicate probable market reversals is essential in the trading business. The rounding bottom chart pattern…
TTrading Strategies Read More 5 minute read What is DPO? Using Detrended Price Oscillator in trading strategiesbyQuantStrategy.io TeamFebruary 18, 2024 A huge variety of indicators is available for usage in the technical analysis sector. Detrended Price Oscillator (DPO)…
TTechnical Indicators Read More 5 minute read What is CMO? Understanding Chande Momentum OscillatorbyQuantStrategy.io TeamFebruary 18, 2024 Nothing measures an asset’s overall momentum just like the CMO indicator or the Chande Momentum Oscillator does. It…
CCrypto Currencies Read More 9 minute read How Does Bitcoin Mining Work? Everything You Need to Know!byQuantStrategy.io TeamFebruary 18, 2024 Welcome to the intricate world of Bitcoin mining, where digital innovation meets decentralized finance. In this comprehensive guide,…
CChart Patterns Read More 8 minute read What is a Point And Figure Chart? How To Trade?byQuantStrategy.io TeamFebruary 18, 2024 In the ever-evolving landscape of financial markets, traders and investors constantly seek tools that provide clear insights into…
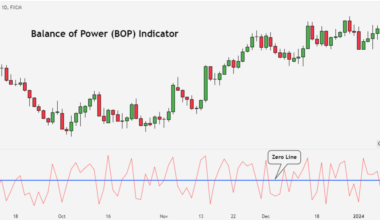
TTrading Strategies Read More 6 minute read Balance of Power: Trading StrategiesbyQuantStrategy.io TeamFebruary 18, 2024 In the intricate landscape of financial markets, mastering the art of trading requires a nuanced understanding of various…