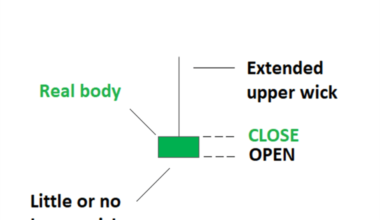
Learn Quant Trading | QuantStrategy.io Learn Quant Trading | QuantStrategy.io
  • Categories
  • Features
    • Category Blocks
    • Content Blocks
      • Accordions
      • Alerts
      • Author
      • Facebook Fanpage
      • Instagram Feed
      • Pinterest Board
      • Progress Bars
      • Separators
      • Share Buttons
      • Social Links
      • Subscription Forms
      • Tabs & Pills
      • Twitter Feed
    • Content Formatting
      • Badges
      • Drop Caps
      • Styled Blocks
      • Styled Lists
      • Numbered Headings
    • Gallery Blocks
    • Promo Blocks
    • Inline Posts
    • Contact Form
  • Sample Page
  • Buy Now

Categories

  • Alpha Lab
  • Candlestick Patterns
  • Chart Patterns
  • Crypto Currencies
  • Custom Indicators
  • Custom Strategies
  • Famous Traders
  • Futures Trading
  • ML And AI Models
  • Options Trading
  • Stocks and ETFs
  • Strategy Backtesting
  • Strategy Filters
  • Technical Indicators
  • Theme Investing
  • Trading Psychology
  • Trading Strategies
Learn Quant Trading | QuantStrategy.io Learn Quant Trading | QuantStrategy.io
Follow
Learn Quant Trading | QuantStrategy.io Learn Quant Trading | QuantStrategy.io
  • Home
  • About Us
price charts

Browsing Category

Technical Indicators

183 posts

Master the tools of the trade. Indicators are mathematical calculations that help us filter price action and find hidden momentum. In this category, we go under the hood of the most powerful tools in a trader’s arsenal—from Moving Averages and RSI to advanced Volatility Bands and Volume-Weighted Average Price (VWAP). Learn the ‘why’ behind the formulas and, more importantly, how to combine them to confirm signals and avoid false breakouts.

TTechnical Indicators

What is PVI? How to Use the Positive Volume Index in Trading

  • byQuantStrategy.io Team
  • April 30, 2023
Positive Volume Index (PVI) is used for technical analysis of the price changes in the market, based on…
TTrading Strategies
Read More
  • 5 minute read

What is RVI? How To Use The Relative Vigor Index Indicator in Trading Strategies

  • byQuantStrategy.io Team
  • April 30, 2023
The Relative Vigor Index (RVI) was created by John Ehlers, a prominent trader, and author of several books…
TTechnical Indicators
Read More
  • 8 minute read

Best Technical Oscillators to Spot Trade Entries and Exits

  • byQuantStrategy.io Team
  • April 29, 2023
Oscillator indicators are considered an essential component for analyzing a currency pair or any other asset class pertaining…
TTechnical Indicators

What is Volume Spread Analysis: How to Use in Trading Strategies

  • byQuantStrategy.io Team
  • April 29, 2023
Volume Spread Analysis (VSA) is a trading methodology that focuses on analyzing the relationship between volume, price and…
TTechnical Indicators

What is CMF? Understanding Chaikin Money Flow Indicator

  • byQuantStrategy.io Team
  • April 28, 2023
Chaikin Money Flow Indicator (CMF) is a momentum indicator that was developed by Marc Chaikin in the 1980s.…
TTechnical Indicators

Guide to Volume Price Analysis: How you can use it in Trading Strategies

  • byQuantStrategy.io Team
  • April 22, 2023
As a trader, understanding how to analyze volume and price movements can be the key to success in…
TTrading Strategies
Read More
  • 6 minute read

How to use hull moving average in trading strategies

  • byQuantStrategy.io Team
  • April 22, 2023
Moving averages play a crucial role in various trading strategies as they help identify trends and potential entry…
TTechnical Indicators
Image by QuantStrategy.io
Read More
  • 4 minute read

What Is SMI Ergodic Indicator? Understanding SMI Ergodic Indicator

  • byQuantStrategy.io Team
  • April 22, 2023
Technical analysis involves the use of charts and indicators to predict future price movements of securities. One of…
TTechnical Indicators
Read More
  • 6 minute read

What is an Ease of Movement Indicator? Understanding Ease of Movement Indicator

  • byQuantStrategy.io Team
  • April 8, 2023
One of the essentials to understanding price movement in day trading is researching volume trends. This is where…
TTrading Strategies
Read More
  • 7 minute read

What is a Trend line? How to Use Trend Lines in Trading Strategies?

  • byQuantStrategy.io Team
  • April 7, 2023
In the simplest form, trend lines are responsible to show connection among multiple prices or explain data in…
Learn Quant Trading | QuantStrategy.io Learn Quant Trading | QuantStrategy.io
Disclaimer | Blog | About | Pricing | Contact Us | Privacy | Terms
0
0
0
0
28
0
0