TTechnical Indicators What is Adaptive Moving Average: How to use in TradingbyQuantStrategy.io TeamJuly 30, 2023 Moving averages are a go-to technical analysis tool in the trading world. While they generate credible entry signals…
TTrading Strategies Understanding Risk Reward Ratio: The Key to Profitable TradingbyQuantStrategy.io TeamJuly 30, 2023 There can be several potentially lucrative trading opportunities, but how can you tell which ones will succeed and…
TTechnical Indicators The Bollinger Bands: How to use in Trading StrategiesbyQuantStrategy.io TeamJuly 29, 2023 Bollinger Bands are a powerful technical analysis tool used by investors and traders to measure market volatility, spot…
TTrading Strategies Heikin Ashi Trading Strategy: A Powerful Tool for TraderbyQuantStrategy.io TeamJuly 29, 2023 If you are a trader, you must have come across various technical indicators, candlestick formations, and chart patterns…
TTrading Strategies Mastering Volatility Trading Strategies: Tips and Techniques for SuccessbyQuantStrategy.io TeamJuly 13, 2023 Price movement is necessary to make a profit in the financial markets. Fortunately, price movements are a constant…
TTechnical Indicators How to Apply DeMarker Indicator in Swing Trading for More ProfitsbyQuantStrategy.io TeamJuly 10, 2023 Swing trading has gained popularity as a form of trading in the financial markets. Swing traders seek to…
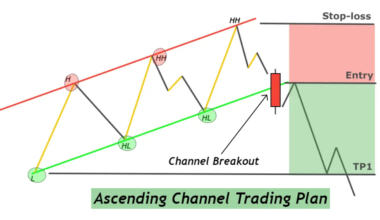
TTrading Strategies Read More 5 minute read The Ascending Channel Pattern: How to TradebyQuantStrategy.io TeamJuly 9, 2023 The channel chart pattern, also known as a price channel, is a powerful technical analysis tool used by…
TTechnical Indicators Read More 6 minute read The Average True Range: Exit StrategiesbyQuantStrategy.io TeamJuly 6, 2023 New traders are often confident about their entries but they do not know when to get out of…
TTrading Strategies The Falling Wedge Pattern: How to TradebyQuantStrategy.io TeamJuly 4, 2023 A wedge chart pattern is formed when two trend lines converge. It denotes that the size of the…