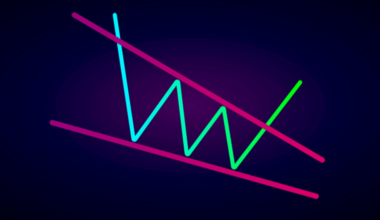
TTrading Strategies The Descending Channel Pattern: How to TradebyQuantStrategy.io TeamOctober 4, 2023 When the lower lows and lower highs are connected in a downward trend, they create a descending channel…
TTrading Strategies The Elliott Wave Theory: How to Trade Elliott WavesbyQuantStrategy.io TeamOctober 2, 2023 There are various ways of trading in the financial markets. The more tools you possess in your trading…
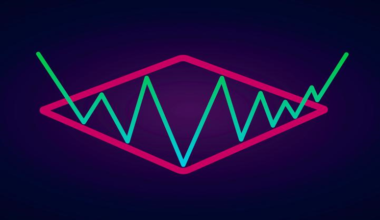
TTrading Strategies Read More 6 minute read How to Trade Diamond Chart PatternsbyQuantStrategy.io TeamAugust 22, 2023 Traders must know what they are looking for when examining a price chart; otherwise, they’ll just be staring…
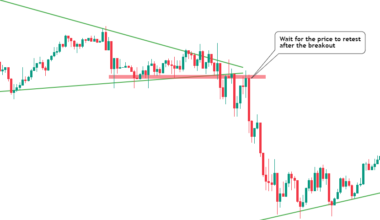
TTrading Strategies Read More 7 minute read Mastering Breakout Trading: Key Techniques for SuccessbyQuantStrategy.io TeamAugust 3, 2023 In the fast-paced world of financial markets, mastering breakout trading is essential for traders seeking consistent success. Breakout…
TTrading Strategies What Is Trading Range? How to use in StrategiesbyQuantStrategy.io TeamAugust 2, 2023 In the world of finance and investment, the term “trading range” refers to the price range within which…
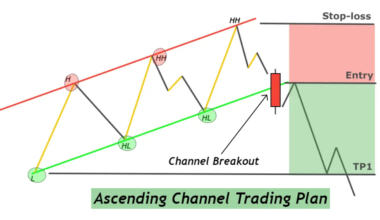
TTrading Strategies Read More 5 minute read The Ascending Channel Pattern: How to TradebyQuantStrategy.io TeamJuly 9, 2023 The channel chart pattern, also known as a price channel, is a powerful technical analysis tool used by…
TTrading Strategies Read More 6 minute read The Falling Wedge Pattern: How to TradebyQuantStrategy.io TeamJuly 4, 2023 A wedge chart pattern is formed when two trend lines converge. It denotes that the size of the…
TTrading Strategies Read More 9 minute read Best Candlestick and Chart Reversal Patterns You Should KnowbyQuantStrategy.io TeamJune 15, 2023 Trading in the financial markets involves analyzing various factors to make informed decisions. One essential aspect of technical…
TTrading Strategies The Rising Wedge Pattern: Trading Strategies for SuccessbyQuantStrategy.io TeamJune 11, 2023 The rising wedge pattern is a popular technical analysis tool used by traders to identify potential reversals and…
TTrading Strategies Read More 9 minute read The Top Harmonic Trading Patterns Every Trader Should KnowbyQuantStrategy.io TeamJune 8, 2023 Traders intrigued by technical analysis must have encountered or perhaps employed chart patterns in trading. Harmonic trading patterns…