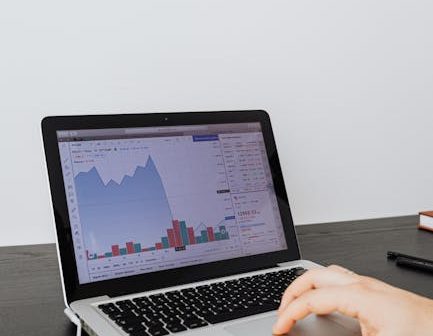
Candlestick charting remains the bedrock of technical analysis, providing a concise, visual story of price action that is indispensable for futures traders. While the principles of candlesticks are universal, their application in the high-leverage, high-volatility futures environment requires specific refinement and contextual understanding. Success in this market hinges on rapidly identifying and exploiting momentary imbalances between buyers and sellers, which is precisely what well-formed patterns reveal. This guide focuses specifically on Decoding Candlestick Patterns for Futures: Identifying High-Accuracy Entry and Exit Signals, transforming basic pattern recognition into a strategic advantage necessary for consistent profitability, complementing the broader lessons outlined in The Ultimate Guide to Futures Trading Strategies: Technical Analysis, Risk Management, and Psychology Mastery.
The Critical Context: High-Accuracy Candlestick Confirmation in Futures
Futures markets, such as E-mini S&P 500 (ES), Nasdaq 100 (NQ), or Crude Oil (CL), are characterized by exceptional liquidity and rapid price movements. Because of the leverage involved, “false signals” are costly. Therefore, a simple pattern recognition is insufficient; high-accuracy entries demand strict confirmation. The two primary confirmation tools for futures traders are Volume and Market Structure.
- Volume Confirmation: A strong reversal pattern (like an Engulfing Bar) must occur on significantly higher volume than preceding candles. This confirms that a large number of participants are involved in the shift of direction, rather than just noise. This is critical for filtering out low-conviction setups.
- Market Structure (Context): The most powerful patterns occur at specific locations: prior support/resistance zones, trendlines, or key moving averages. A Bullish Pin Bar appearing mid-channel is low-probability; the same Pin Bar appearing right at the 200-period Exponential Moving Average (EMA) or a swing low is high-probability. This concept aligns strongly with finding Mastering Swing Trading Futures: High-Probability Setups and Entry Techniques for Consistent Gains.
Decoding Reversal Patterns for High-Probability Entries
Reversal patterns provide the sharpest entry signals, maximizing the risk/reward ratio by catching the beginning of a move. In futures, focus on patterns that show dramatic rejection of price levels:
1. The Engulfing Pattern (Bullish and Bearish)
The Engulfing pattern occurs when the real body of the current candle completely covers the real body of the previous candle, signaling a decisive power shift. This is perhaps the most reliable two-candle pattern in futures when accompanied by volume spike.
Case Study 1: Bullish Engulfing in ES Futures
During a downtrend in E-mini S&P 500 (ES), the price retraces to a major daily support level. A small red (bearish) candle forms. The next candle opens lower but rallies aggressively, closing significantly above the previous candle’s open, forming a large green body on heavy volume. This massive conviction shift provides the entry signal.
- Entry Signal: Buy 1 tick above the high of the Bullish Engulfing candle.
- Stop Loss: Place the stop 1 tick below the low of the Bullish Engulfing candle. This uses the pattern itself to define the immediate risk, a core principle of Advanced Risk Management Techniques for Futures: Position Sizing and Stop Loss Optimization.
2. Pin Bar (Hammer or Shooting Star)
The Pin Bar is characterized by a long wick (tail) and a small real body, showing that price attempted to push significantly in one direction but was forcefully rejected. The length of the wick relative to the body dictates the conviction of the reversal.
In futures, especially highly volatile markets like Crude Oil (CL), a Pin Bar formed off a tested resistance level (Shooting Star) offers a high-accuracy short entry. The long wick indicates that buyers attempted to push higher but were overwhelmed by sellers at that specific price point.
Continuation Patterns for Trend Confirmation and Scalping
While reversal patterns define the start of a large move, continuation patterns confirm that an existing trend remains robust. These are excellent for adding to winning positions or initiating trend-following trades, often in conjunction with Essential Technical Analysis Tools for Futures Traders: Beyond Basic Moving Averages and RSI.
Three White Soldiers / Three Black Crows
This pattern consists of three consecutive candles moving strongly in the same direction, with each candle opening within the body of the previous one and closing higher/lower than the previous close. This signals overwhelming momentum.
Case Study 2: Three White Soldiers in Gold Futures (GC)
After a breakout above a critical trendline in Gold Futures (GC), the appearance of Three White Soldiers confirms that the bullish momentum is aggressive and sustainable. Traders using this signal would target the projected measure move based on the flagpole preceding the breakout. This is a powerful indication that one should stay with the trade, aligning with disciplined strategies necessary for Conquering Trading Psychology in Futures: Handling Drawdowns and Emotional Discipline for Peak Performance.
Using Candlesticks for High-Accuracy Exits
Many traders focus solely on entry signals, yet the exit strategy defines profitability. Candlestick patterns offer objective exit signals that remove subjective judgment:
- Protective Stop Adjustment: Once a trade is underway, a powerful opposing reversal pattern (e.g., a Bearish Engulfing during a long trade) serves as a clear signal that momentum has shifted. This can trigger a move-to-break-even or immediate profit-taking, even if the ultimate target has not been reached.
- Trailing Stops with Pattern Breaks: Instead of using arbitrary price distances, trail your stop loss based on the low (for longs) or high (for shorts) of preceding structural candles. A close below the low of a strong, prior bullish candle indicates a structural breakdown and a mandatory exit. Backtesting these exit rules is essential for refining accuracy, as detailed in How to Effectively Backtest Futures Trading Strategies Using Historical Data and Simulation Software.
Incorporating the Doji as an Early Warning System
The Doji (where the opening and closing price are virtually identical) represents indecision. In futures trading, a Doji appearing near your profit target, especially after a strong run, is a critical early warning signal. It tells you that the consensus of the market is breaking down and aggressive buyers/sellers are losing control. While not an immediate exit signal, it prompts the trader to tighten the stop immediately. For further insight into momentum indicators, consider reviewing Top 5 Technical Indicators Proven to Work in High-Volatility Futures Markets.
Conclusion
Decoding candlestick patterns for futures trading goes beyond memorization; it demands contextual confirmation—volume, market structure, and the overall time frame. By focusing on high-conviction signals like the confirmed Engulfing Pattern and using Pin Bars to define precise risk, futures traders can establish objective entry and exit points. Remember, the accuracy of any pattern improves exponentially when it confirms a key technical level, a principle that underpins all effective futures strategies. To master the integration of these technical tools with comprehensive risk management and psychological discipline, delve deeper into The Ultimate Guide to Futures Trading Strategies: Technical Analysis, Risk Management, and Psychology Mastery.
Frequently Asked Questions (FAQ)
What is the most reliable candlestick pattern for futures entries?
The Engulfing Pattern (especially when supported by high volume) is often considered the most reliable. Its reliability stems from the decisive nature of the signal: the power shift is so complete that the current candle entirely negates the previous one, signaling high conviction at a key turning point.
How do I confirm a candlestick pattern signal is valid in a high-volatility futures market?
Confirmation requires two primary elements: 1) Location—the pattern must form at a known structural level (support, resistance, pivot point). 2) Volume—the reversal candle should exhibit significantly higher volume than the preceding candles, indicating institutional participation in the price rejection. Further confirmation can be sought using momentum indicators, discussed in Building Custom Indicators (Pine Script/Python) to Gain an Algorithmic Edge in Futures Trading.
Should I trade candlestick patterns on lower time frames (e.g., 5-minute chart) in futures?
Yes, but with caution. Patterns on lower time frames are often used for day trading entries but generate more noise. For high-accuracy signals, traders should prioritize patterns that align with the direction of the higher time frame (1-hour or 4-hour trend), a principle fundamental to successful Day Trading vs. Swing Trading Futures.
What role does the Doji play in futures trading signals?
The Doji is primarily an alert or warning signal, not an entry signal. When a Doji appears after a prolonged move or near a major price level, it signals market indecision. Traders holding positions should tighten stops or prepare for a potential reversal, using it as an early exit indicator rather than a new entry point.
How does candlestick analysis relate to managing risk in a futures trade?
Candlestick patterns are essential for risk management because they provide objective stop-loss placement. The protective stop is typically set just outside the extreme high or low of the signal candle (e.g., 1 tick beyond the wick of a Pin Bar). This mechanism ensures that if the market negates the pattern premise, the trade is automatically terminated with minimal loss.
Are specific patterns more effective in certain futures instruments, like Crude Oil vs. NQ?
While the patterns themselves are universal, highly volatile contracts like Crude Oil (CL) or Nasdaq (NQ) often produce larger wicks (Pin Bars) due to rapid liquidity sweeps. In these markets, filtering signals using volume spikes and ensuring the wick forms at a clear institutional level (like overnight high/low) is even more crucial for maintaining high-accuracy setups, drawing from Lessons from Legendary Futures Traders.