Learn Quant Trading | QuantStrategy.io Learn Quant Trading | QuantStrategy.io
  • Categories
  • Features
    • Category Blocks
    • Content Blocks
      • Accordions
      • Alerts
      • Author
      • Facebook Fanpage
      • Instagram Feed
      • Pinterest Board
      • Progress Bars
      • Separators
      • Share Buttons
      • Social Links
      • Subscription Forms
      • Tabs & Pills
      • Twitter Feed
    • Content Formatting
      • Badges
      • Drop Caps
      • Styled Blocks
      • Styled Lists
      • Numbered Headings
    • Gallery Blocks
    • Promo Blocks
    • Inline Posts
    • Contact Form
  • Sample Page
  • Buy Now

Categories

  • Alpha Lab
  • Candlestick Patterns
  • Chart Patterns
  • Crypto Currencies
  • Custom Indicators
  • Custom Strategies
  • Famous Traders
  • Futures Trading
  • ML And AI Models
  • Options Trading
  • Stocks and ETFs
  • Strategy Backtesting
  • Strategy Filters
  • Technical Indicators
  • Theme Investing
  • Trading Psychology
  • Trading Strategies
Learn Quant Trading | QuantStrategy.io Learn Quant Trading | QuantStrategy.io
Follow
Learn Quant Trading | QuantStrategy.io Learn Quant Trading | QuantStrategy.io
  • Home
  • About Us
price charts

Browsing Category

Technical Indicators

187 posts

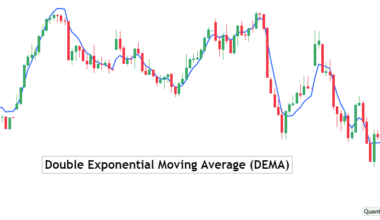
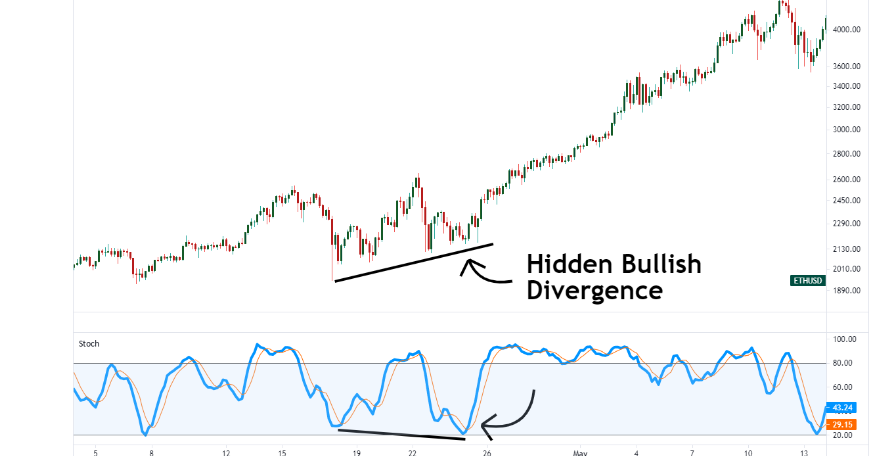
Master the tools of the trade. Indicators are mathematical calculations that help us filter price action and find hidden momentum. In this category, we go under the hood of the most powerful tools in a trader’s arsenal—from Moving Averages and RSI to advanced Volatility Bands and Volume-Weighted Average Price (VWAP). Learn the ‘why’ behind the formulas and, more importantly, how to combine them to confirm signals and avoid false breakouts.

TTechnical Indicators
Read More
  • 5 minute read

How to Trade with Volume RSI Indicator

  • byQuantStrategy.io Team
  • March 31, 2024
Every day trader knows two key elements of trading – Price action and volume. Approximately every strategy, indicator,…
TTechnical Indicators

Williams R vs RSI: Which is Better?

  • byQuantStrategy.io Team
  • March 21, 2024
There are many technical indicators available to identify potential entry and exit points, decipher market trends, and make…
TTechnical Indicators
Read More
  • 6 minute read

Relative Strength Index vs Commodity Channel Index: Which is Better?

  • byQuantStrategy.io Team
  • March 21, 2024
Oscillators are among the most significant and popular indicators in the financial markets. They are important because of…
TTechnical Indicators
Read More
  • 6 minute read

Mastering Double Bottom Chart Pattern Trading with MACD Confirmation

  • byQuantStrategy.io Team
  • March 21, 2024
In the vast world of financial markets, chart patterns are important tools for traders to enhance the decision-making…
TTechnical Indicators
Read More
  • 6 minute read

Mastering Moving Averages and Fibonacci Retracement Strategy

  • byQuantStrategy.io Team
  • March 21, 2024
In the realm of technical analysis, two technical indicators stand out as pillars of understanding market movements and…
TTechnical Indicators

Demystifying the SuperSmoother: A Powerful Smoothing Algorithm

  • byQuantStrategy.io Team
  • March 18, 2024
In the world of data analysis and technical trading, smoothing techniques play a crucial role in filtering out…
TTechnical Indicators
Read More
  • 6 minute read

The Smoothed Hull Moving Average (HMA) Trading Strategies for Success

  • byQuantStrategy.io Team
  • March 17, 2024
The Smoothed Hull Moving Average (HMA) is a technical indicator developed by Alan Hull designed to offer a…
TTechnical Indicators

Understanding the Schaff Trend Cycle (STC) Indicator: A Powerful Technical Analysis Tool

  • byQuantStrategy.io Team
  • March 17, 2024
The Schaff Trend Cycle (STC) is a versatile technical indicator developed by Doug Schaff. It’s designed to provide…
TTechnical Indicators

Exploring the Prime Number Bands Indicator

  • byQuantStrategy.io Team
  • March 16, 2024
The Prime Number Bands indicator is a unique technical analysis tool developed by Modulus Financial Engineering Inc. Unlike…
TTechnical Indicators

Understanding the Central Pivot Range (CPR) Indicator: A Powerful Tool for Intraday Trading

  • byQuantStrategy.io Team
  • March 16, 2024
The Central Pivot Range (CPR) indicator is a versatile technical analysis tool favored by intraday traders. CPR helps…
Learn Quant Trading | QuantStrategy.io Learn Quant Trading | QuantStrategy.io
Disclaimer | Blog | About | Pricing | Contact Us | Privacy | Terms
0
0
0
0
28
0
0