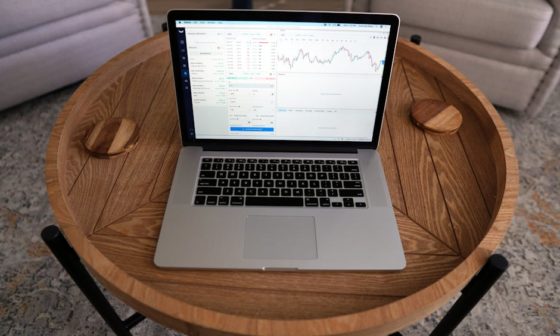
Moving beyond simple candlestick charts requires traders to develop a nuanced understanding of market microstructure—the underlying mechanism of supply and demand. The Level 2 order book is the window into this mechanism, offering a dynamic, real-time view of resting limit orders that define current market depth and the intent of participants. For those serious about precision execution and identifying short-term price pressure, learning How to Read the Level 2 Order Book: A Beginner’s Guide to Market Depth and Order Flow is non-negotiable. This data shows exactly where the liquidity is pooled, providing clues to future price direction and helping identify true support and resistance levels. This foundational skill is the necessary precursor to implementing the more advanced strategies discussed in our comprehensive guide, Mastering Order Book Depth: Advanced Strategies for Identifying Liquidity, Support, and Resistance.
Understanding the Components of the Level 2 Order Book
The Level 2 order book, often simply called L2, displays more than just the National Best Bid and Offer (NBBO). It provides a tiered hierarchy of limit orders waiting to be executed at various price levels. Unlike Level 1 data, which only shows the best Bid and best Ask, L2 shows the depth—how many shares or contracts are available at successively higher prices (on the Ask side) or lower prices (on the Bid side).
The Bid and Ask Side Explained
The Level 2 display is fundamentally split into two columns representing opposing market forces:
- The Bid Side (Demand): This lists all outstanding limit buy orders. The highest price listed is the Best Bid, representing the maximum price a buyer is currently willing to pay. As you move down the list, prices decrease, and the corresponding quantities represent demand away from the market price.
- The Ask Side (Supply): This lists all outstanding limit sell orders (offers). The lowest price listed is the Best Ask, representing the minimum price a seller is currently willing to accept. As you move down the list, prices increase, and the corresponding quantities represent supply away from the market price.
The difference between the Best Ask and the Best Bid is the Bid-Ask Spread. A tight spread generally indicates high liquidity, making execution cheaper, a concept vital for traders seeking to improve fill prices, as detailed in Minimizing Trading Costs: Analyzing the Bid-Ask Spread and Market Impact in High-Volume Trading.
Decoding Market Maker and ECN Attribution
In traditional equity markets, Level 2 data often attributes the standing orders to specific market makers or Electronic Communication Networks (ECNs). While newer data feeds and crypto markets often aggregate this information, understanding attribution remains crucial:
- Market Makers: Large institutional firms that stand ready to buy or sell to provide continuous liquidity. Their presence (or sudden absence) can indicate institutional sentiment.
- ECNs: Automated trading systems that match buy and sell orders. Different ECNs may cater to different types of participants (e.g., retail versus institutional flow).
The total volume displayed across all price levels provides the market depth. A highly liquid stock will show thick depth across many price tiers, cushioning against rapid price changes when a large market order hits the book.
Deciphering Market Depth and Liquidity
Market depth is the core quantitative metric derived from Level 2 data. It measures the robustness of supply and demand at various levels. Interpreting depth is key to predicting how stable a price level is and where volatility might increase.
| Bid Price | Bid Size (Shares) | Ask Price | Ask Size (Shares) |
|---|---|---|---|
| $100.00 (Best Bid) | 1,200 | $100.02 (Best Ask) | 500 |
| $99.95 | 800 | $100.05 | 1,500 |
| $99.90 | 2,500 | $100.10 | 900 |
| $99.80 | 10,000 ← (Liquidity Wall) | $100.20 | 2,000 |
In the table above, the largest resting order is 10,000 shares at $99.80. This significant cluster of orders acts as a potential support level, meaning the price is likely to pause or bounce if it approaches $99.80. Conversely, if $100.02 is thin (only 500 shares), a buyer only needs to cross those 500 shares to push the price up to the next level, $100.05.
Traders must differentiate between thick depth (robust, stable market) and thin depth (volatile, prone to large swings). Thin depth often occurs during news events or off-hours, creating risks that require caution when executing large orders.
Analyzing Order Flow: What L2 Tells You About Intent
While Level 2 displays resting (limit) orders, understanding order flow requires monitoring how these orders interact with executed (market) orders. This combination is essential for understanding short-term price action, a process often complemented by advanced strategies like those detailed in Exploiting Market Depth Skew: Advanced Custom Strategies for Predicting Short-Term Price Movement.
Reading the Time & Sales (Tape) in Conjunction with L2
Level 2 (the book) represents passive intent; the Time & Sales window (the tape) represents active execution. You must read them together:
- If large trades print on the tape at the Ask price, it means aggressive buyers are consuming resting supply, suggesting upward momentum. The Ask side of the L2 will visibly thin out.
- If large trades print on the tape at the Bid price, aggressive sellers are consuming resting demand, suggesting downward pressure. The Bid side of the L2 will thin out.
The key indicator is Order Flow Imbalance. If the total volume waiting on the Bid side far exceeds the total volume waiting on the Ask side, the market has a bias toward demand, but it also means sellers only have to overcome a smaller amount of supply to push the price down quickly if they suddenly become aggressive.
Identifying Potential Support and Resistance
In L2 analysis, massive accumulations of shares at a specific price level are often referred to as “liquidity walls.”
- Resistance Walls: Large volume stacked on the Ask side above the current price. Traders must break through this supply to continue upward.
- Support Walls: Large volume stacked on the Bid side below the current price. This acts as a floor, preventing short-term drops unless the conviction of sellers is overwhelming.
However, beware of manipulation. These large walls may be spoofing orders—placed with no intent to execute, designed to lure other traders, and then quickly canceled, a common tactic used by High-Frequency Trading (HFT) algorithms, as explored in The HFT Impact: How Algorithmic Trading Shapes Order Book Dynamics and Liquidity Pools.
Practical Application: Case Studies in Order Book Reading
Applying L2 knowledge requires rapid pattern recognition and the ability to distinguish genuine interest from market noise.
Case Study 1: Testing the Liquidity Wall (Support Confirmation)
A stock is trending down towards a previously identified technical support level of $50.00. The Level 2 book shows a total of 15,000 shares stacked between $49.90 and $50.00, forming a significant wall. The price hits $50.00, and sellers aggressively start printing trades at the $50.00 Bid price. We observe the following:
- The Bid size at $50.00 barely decreases, suggesting the 15,000 shares are legitimate and being replaced immediately (reloading) or that the order is actually a large iceberg order (a large order hidden behind smaller visible portions).
- After 5,000 shares are consumed, selling pressure fades, and the price ticks back up to $50.01.
Actionable Insight: The $50.00 level held, confirming strong defensive buying. This suggests an entry opportunity for a long position, expecting a bounce off the established support, a tactic central to Identifying True Support and Resistance Levels Using Order Book Depth Analysis and Volume Clustering.
Case Study 2: Detecting Supply Exhaustion
Stock ZYX is undergoing a strong upward rally, trading at $75.00. The order book shows a significant imbalance: 5,000 shares on the Bid side near the market, but only 500 shares total on the Ask side up to $75.20. As the price pushes to $75.01, the 500 Ask shares are consumed instantly.
- The Ask side remains extremely thin (or “gapped”) above $75.01, with the next resting sell order not appearing until $75.50.
- A single small market order (e.g., 200 shares) suddenly prints, jumping the price from $75.01 immediately to $75.50.
Actionable Insight: The thin Ask depth indicated supply exhaustion. When sellers step away, the market is highly susceptible to rapid, volatile price spikes (a run). This scenario highlights the critical relationship between market depth and short-term volatility, a concept explored in The Psychology of Liquidity: How Order Book Gaps and Density Affect Trader Behavior and Panic Selling.
Conclusion and Next Steps
The Level 2 order book is the purest depiction of immediate supply and demand dynamics. Mastering its interpretation—by assessing market depth, identifying imbalances, and comparing resting limit orders against active market execution (the tape)—allows beginners to move past lagging indicators and gain predictive insights into short-term price movement. While this guide covers the fundamentals, the sophisticated world of algorithmic trading and order book manipulation requires deeper study into advanced techniques like identifying spoofing and analyzing order flow skew. To continue your journey from beginner interpretation to advanced quantitative strategies, we highly recommend diving into our central resource: Mastering Order Book Depth: Advanced Strategies for Identifying Liquidity, Support, and Resistance, where we discuss complex models for predicting price with AI and Machine Learning based on this rich data set.
Frequently Asked Questions
What is the key difference between Level 1 and Level 2 data?
Level 1 data shows only the current best price buyers are willing to pay (Best Bid) and the best price sellers are willing to accept (Best Ask), along with the quantity at those specific levels. Level 2 data, conversely, displays a list of all outstanding limit orders across multiple price tiers, revealing the depth of supply and demand away from the current market price.
How does “market depth” relate to liquidity when reading Level 2?
Market depth is the measure of total standing orders (size) listed across all visible price tiers in the L2 book. High market depth, especially near the Best Bid and Ask, indicates high liquidity. High liquidity means that a large order can be executed with minimal impact on the price, making the market more stable and reducing slippage.
What is Order Flow Imbalance, and why is it important for beginners?
Order Flow Imbalance occurs when the accumulated size on one side of the book (e.g., total shares on the Bid side) significantly outweighs the other (Ask side). For beginners, spotting a large imbalance signals a potential short-term pressure point. If Bids greatly exceed Asks, the current demand is robust, but the price is highly sensitive to any aggressive selling because there is less supply to absorb it immediately.
Can I rely on a large order block in Level 2 to guarantee support or resistance?
No. While large order blocks (liquidity walls) indicate potential support or resistance, they are not guaranteed. Traders must watch if the orders remain when the price approaches (confirmation) or if they are quickly withdrawn (cancellation), which is a characteristic of spoofing or manipulative behavior. Advanced traders often use volume indicators and the tape to verify the legitimacy of these walls.
How do I combine the Time & Sales with the Level 2 Order Book?
Level 2 shows passive intent (limit orders); Time & Sales (the tape) shows active execution (market orders). A beginner should watch the tape to see where trades are filling: if market orders continually execute at the Ask price, it means buyers are aggressive and consuming supply, confirming upward pressure suggested by the L2 imbalances.
Are Level 2 books the same in traditional equity markets versus crypto markets?
The fundamental structure (Bids, Asks, Size) is the same, but the implementation differs significantly. Equity L2 traditionally includes specific ECN/Market Maker attribution (vital for institutional flow analysis). Crypto order books, as discussed in Market Depth Differences: Analyzing Crypto Order Books Versus Traditional Equity Markets, are usually consolidated and lack detailed attribution, making volume and depth aggregation the primary focus for analysis.
What is the primary goal of reading Level 2 data in the context of advanced strategies?
The primary goal is to gain a microstructure edge—predicting the immediate short-term price movement and ensuring optimal trade execution. This foundational understanding allows for the development of sophisticated quantitative models, such as integrating Level 2 data with VWAP calculations, as highlighted in Optimizing Trade Execution: Integrating VWAP with Real-Time Order Book Data for Best Fill Price.