Learn Quant Trading | QuantStrategy.io Learn Quant Trading | QuantStrategy.io
  • Categories
  • Features
    • Category Blocks
    • Content Blocks
      • Accordions
      • Alerts
      • Author
      • Facebook Fanpage
      • Instagram Feed
      • Pinterest Board
      • Progress Bars
      • Separators
      • Share Buttons
      • Social Links
      • Subscription Forms
      • Tabs & Pills
      • Twitter Feed
    • Content Formatting
      • Badges
      • Drop Caps
      • Styled Blocks
      • Styled Lists
      • Numbered Headings
    • Gallery Blocks
    • Promo Blocks
    • Inline Posts
    • Contact Form
  • Sample Page
  • Buy Now

Categories

  • Candlestick Patterns
  • Chart Patterns
  • Crypto Currencies
  • Custom Indicators
  • Custom Strategies
  • Famous Traders
  • ML And AI Models
  • Research
  • Strategy Backtesting
  • Strategy Filters
  • Technical Indicators
  • Trading Psychology
  • Trading Strategies
Learn Quant Trading | QuantStrategy.io Learn Quant Trading | QuantStrategy.io
Follow
Learn Quant Trading | QuantStrategy.io Learn Quant Trading | QuantStrategy.io
  • Home
  • About Us
price charts

Browsing Category

Technical Indicators

140 posts

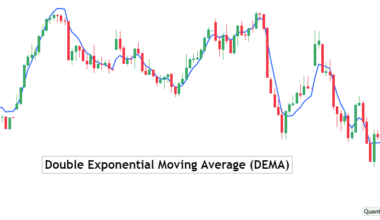
A technical indicator is an analytical tool used by traders to gain insight into the performance of a security, such as a currency pair or stock index. The indicator could be composed of one or several variables, and can be based on simple patterns existing in the past price performances or on complex algorithmic principles. Technical indicators are used by investors to identify trends, define profitable entry and exit points as well as possible risk exposure points. It is important to understand how each indicator works and identify any bias in their depiction of the securities during analysis before deciding which technical strategies to pursue.

TTechnical Indicators

Understanding the Central Pivot Range (CPR) Indicator: A Powerful Tool for Intraday Trading

  • byQuantStrategy.io Team
  • March 16, 2024
The Central Pivot Range (CPR) indicator is a versatile technical analysis tool favored by intraday traders. CPR helps…
TTechnical Indicators
Read More
  • 5 minute read

Combining Head and Shoulders Pattern with MACD Trading Strategy

  • byQuantStrategy.io Team
  • March 15, 2024
In the dynamic environment of technical analysis, traders are constantly looking for comprehensive tools to predict price movements…
TTechnical Indicators
Read More
  • 7 minute read

Combining ADX and Moving Averages for Trading Success

  • byQuantStrategy.io Team
  • March 15, 2024
Has the abundance of advanced technical indicators ever left you feeling overwhelmed as a trader? You aren’t alone.…
TTechnical Indicators
Read More
  • 8 minute read

Combining Ichimoku Cloud and Bollinger Bands for Trading Success

  • byQuantStrategy.io Team
  • March 15, 2024
Traders use a variety of technical indicators in Forex trading to identify trends, determine market sentiment, and make…
TTrading Strategies
Read More
  • 10 minute read

What is the Ichimoku Cloud and how to use it in Trading Strategies

  • byQuantStrategy.io Team
  • March 15, 2024
Technical indicators are deployed by most traders in the markets. One of the major problems faced while using…
TTechnical Indicators
How to use Williams Percent Range (%R) Indicator in Trading Strategies
Read More
  • 4 minute read

The Pattern Recognition Indicators

  • byQuantStrategy.io Team
  • March 14, 2024
Technical analysis, a cornerstone of navigating the dynamic world of financial markets, relies heavily on identifying patterns in…
TTechnical Indicators

What is Oscillator of a Moving Average (OSMA): How to use in Trading?

  • byQuantStrategy.io Team
  • March 14, 2024
Technical analysis offers a vast array of tools for traders to navigate the ever-evolving landscape of the financial…
TTechnical Indicators
Read More
  • 5 minute read

The Power of Moving Average Crossovers: A Guide to Trading Strategies

  • byQuantStrategy.io Team
  • March 13, 2024
Technical analysis offers a vast array of tools for traders to dissect market behavior and identify potential trading…
TTechnical Indicators

Unveiling the Fractal Chaos Oscillator: A Tool for Navigating Market Chaos

  • byQuantStrategy.io Team
  • March 12, 2024
The ever-evolving dance of the stock market can be both exhilarating and perplexing for traders. While technical analysis…
TTechnical Indicators

The Double Stochastic: A Powerful Tool for Identifying Trading Opportunities

  • byQuantStrategy.io Team
  • March 12, 2024
Technical analysis offers a vast array of tools for traders to dissect market behavior and identify potential trading…
Learn Quant Trading | QuantStrategy.io Learn Quant Trading | QuantStrategy.io
Disclaimer | Blog | About | Pricing | Contact Us | Privacy | Terms
0
0
0
0
25
0
0