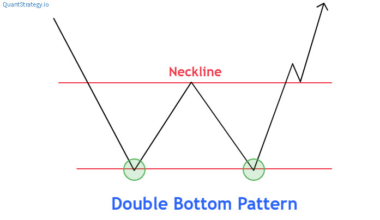
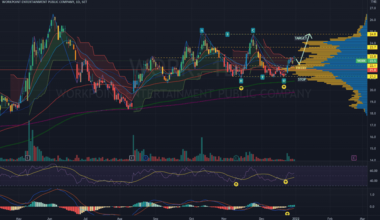
TTrading Strategies Read More 5 minute read How to Trade Double Bottom PatternsbyQuantStrategy.io TeamMay 3, 2024 A double bottom pattern is a commonly used chart pattern in technical analysis. It is more specifically a…
TTrading Psychology Affirmations for Traders: Harnessing the Power of Positive Self-TalkbyQuantStrategy.io TeamApril 16, 2024 Successful trading isn’t just about technical analysis or market knowledge. Your mindset plays a crucial role in navigating…
TTrading Psychology Visualization for Traders: The Power of Mental Rehearsal for SuccessbyQuantStrategy.io TeamApril 16, 2024 Visualization, the practice of creating vivid mental images, isn’t just for athletes or self-help enthusiasts. Traders increasingly recognize…
TTrading Psychology Read More 3 minute read Emotions in Trading: Understanding Their Impact and Mastering ControlbyQuantStrategy.io TeamApril 12, 2024 Trading can be a highly emotional experience. Fear, greed, excitement, and frustration can all surface as we navigate…
TTrading Psychology Patience for Trading: The Key to Long-term SuccessbyQuantStrategy.io TeamApril 12, 2024 Trading the financial markets, even for the most experienced investors, can be a rollercoaster of emotions. Impatience, often…
TTrading Psychology Essential Trading Psychology Books: Transform Your Mindset, Master Your TradesbyQuantStrategy.io TeamApril 12, 2024 Trading success doesn’t just come from technical analysis or market knowledge. Your mindset plays a monumental role in…
CCrypto Currencies The Psychology of Crypto Millionaires: Understanding the Mindset of Early AdoptersbyQuantStrategy.io TeamApril 11, 2024 Cryptocurrencies have created a new wave of wealth seemingly overnight. While the market is known for its volatility,…
TTrading Psychology Learning from Losses in Trading: A Guide to Transforming Setbacks into SuccessbyQuantStrategy.io TeamApril 11, 2024 The first step to learning from losses is to accept them as an unavoidable aspect of trading. No…
TTechnical Indicators Read More 4 minute read Understanding the Acceleration Bands IndicatorbyQuantStrategy.io TeamApril 6, 2024 There are a number of different indicators that traders can use when trading Forex, crypto currencies or other…
TTechnical Indicators Read More 5 minute read How to Trade with Volume RSI IndicatorbyQuantStrategy.io TeamMarch 31, 2024 Every day trader knows two key elements of trading – Price action and volume. Approximately every strategy, indicator,…