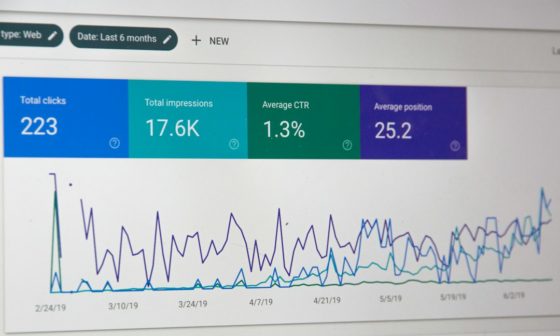
John Murphy’s pioneering work on Intermarket Analysis: Understanding Global Market Relationships – John Murphy fundamentally changed how traders view individual asset classes. In his seminal book, The Ultimate Guide to Technical Analysis of the Financial Markets by John Murphy, he argues that no market exists in a vacuum. By analyzing the correlations between stocks, bonds, commodities, and currencies, traders can gain a macroscopic view of the financial landscape. This approach helps identify when a trend in one sector is supported or contradicted by movement in another, providing a powerful layer of confirmation beyond traditional chart patterns.
Validate your strategy with instant backtesting
Backtest LibraryThe Four Pillars of Intermarket Relationships
Murphy identifies four major asset classes that interact in predictable ways. Understanding these links is vital when Backtesting Murphy’s Strategies to see if classic correlations still hold in today’s high-frequency environment. The four pillars are:
- Stocks and Bonds: Traditionally, bond prices and stock prices move in the same direction (and inverse to interest rates). However, during periods of high inflation, this relationship can decouple.
- Bonds and Commodities: There is a strong inverse relationship here. Rising commodity prices signal inflation, which leads to higher interest rates and lower bond prices.
- Commodities and the US Dollar: Most commodities are priced in Dollars. Therefore, a strengthening Dollar usually exerts downward pressure on commodity prices like Gold and Oil.
- The US Dollar and Interest Rates: Generally, higher interest rates attract foreign capital, strengthening the currency.
Actionable Insights for Modern Traders
To apply Intermarket Analysis: Understanding Global Market Relationships – John Murphy effectively, traders should use one market as a leading indicator for another. For instance, if you are Identifying Reversal Patterns on a stock index, look to the bond market for confirmation. A breakdown in bond prices often precedes a top in the stock market.
Furthermore, integrating Volume and Open Interest within these intermarket shifts can reveal the conviction of institutional players. If the Dollar is rising on high volume while Gold is hitting a resistance level, the probability of a bearish reversal in Gold increases significantly.
Case Studies in Intermarket Dynamics
Example 1: The 2022 Inflationary Spike
As commodity prices (specifically energy and wheat) surged, intermarket analysis provided an early warning for bond investors. The sharp rise in commodities signaled that the Fed would need to hike rates aggressively. Traders who watched the relationship between commodities and bonds were able to exit long bond positions long before the standard Oscillators and Momentum tools signaled a “sell” on daily charts.
Example 2: Tech Stocks and the 10-Year Yield
In the modern era, the Nasdaq 100 has shown a high sensitivity to the 10-year Treasury yield. When yields rise rapidly, growth stocks often face valuation compression. By applying Mastering Support and Resistance levels to the 10-year yield chart, a trader can better predict potential “risk-off” rotations in the equity markets.
Psychology and Global Sentiment
The intermarket approach is deeply tied to The Psychology of Charting: Insights from Murphy’s Technical Analysis. It reflects the “Risk-On” versus “Risk-Off” sentiment of global participants. When traders are fearful, they move capital from commodities and stocks into the safety of bonds and the US Dollar. Recognizing these shifts across borders is the hallmark of a professional macro-technical analyst.
Conclusion
Mastering Intermarket Analysis: Understanding Global Market Relationships – John Murphy allows a trader to look beyond a single price chart and understand the “why” behind major market moves. By monitoring the interplay between bonds, currencies, and commodities, you can validate your technical setups and avoid being caught on the wrong side of a macro trend. This holistic view is a cornerstone of the methodologies found in The Ultimate Guide to Technical Analysis of the Financial Markets by John Murphy, providing the context necessary for long-term trading success.
Frequently Asked Questions
| What is the primary goal of Intermarket Analysis? | The goal is to use the relationships between different asset classes (stocks, bonds, commodities, and currencies) to confirm trends and identify potential reversals in a specific market. |
| How does the US Dollar affect Gold prices according to Murphy? | Murphy highlights a strong inverse relationship; as the US Dollar strengthens, Gold typically weakens because it becomes more expensive for holders of other currencies. |
| Can these principles be applied to digital assets? | Yes, many traders are now Applying John Murphy’s Technical Analysis to Crypto Markets by observing how Bitcoin correlates with the Nasdaq or the Dollar Index. |
| Why are bond prices considered a leading indicator for stocks? | Bond prices reflect interest rate expectations; since interest rates affect corporate borrowing costs and equity valuations, bonds often turn before the stock market does. |
| Does Intermarket Analysis replace traditional chart patterns? | No, it complements them. It provides a macro filter that helps confirm whether a pattern, like a Head and Shoulders, is supported by broader economic flows. |
| What is the relationship between commodities and bonds? | They generally move in opposite directions because rising commodity prices are inflationary, which leads to higher interest rates and lower bond prices. |
| How does this fit into Murphy’s broader “Ultimate Guide”? | It serves as the bridge between pure technical analysis and fundamental macroeconomics, as detailed in The Ultimate Guide to Technical Analysis of the Financial Markets by John Murphy. |