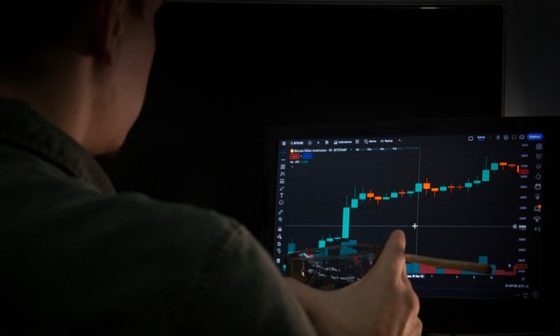
In the foundational text The Ultimate Guide to Technical Analysis of the Financial Markets by John Murphy, the relationship between price, volume, and open interest serves as the ultimate litmus test for trend sustainability. Murphy posits that Volume and Open Interest: The Murphy Approach to Market Strength provides the necessary confirmation that a price move is backed by “smart money” rather than retail noise. By analyzing these two secondary indicators, traders can discern whether a trend is gaining genuine momentum or if it is nearing exhaustion, allowing for more precise entries near mastering support and resistance levels.
The Core Principles of Volume Analysis
According to John Murphy, volume is the fuel that drives the market engine. The primary rule is that volume should expand in the direction of the prevailing price trend. In an uptrend, volume should increase on rallies and decrease on corrections. Conversely, in a downtrend, volume should increase on price drops and decrease on bounces.
When volume begins to diverge from price—for example, if a market makes new highs on lower volume—it signals a lack of conviction. This often precedes identifying reversal patterns such as the Head and Shoulders. Traders often use oscillators and momentum alongside volume to confirm these turning points.
Understanding Open Interest in Futures and Options
Open interest (OI) is a metric unique to derivative markets, representing the total number of outstanding contracts that have not been settled. Murphy uses OI to track the flow of capital. The interaction between price and OI creates four distinct signals:
| Price Action | Open Interest Change | Murphy’s Interpretation |
|---|---|---|
| Rising | Rising | Technical Strength (New Buyers) |
| Rising | Falling | Technical Weakness (Short Covering/Liquidation) |
| Falling | Rising | Technical Weakness (New Selling) |
| Falling | Falling | Technical Strength (Long Liquidation) |
This data is particularly useful when applying technical analysis to crypto markets, where perpetual futures volume often dictates the spot price direction.
Practical Application: Actionable Insights
To implement the Murphy approach effectively, consider the following practical steps:
- Look for Climax Volume: A massive spike in volume after a long move often signals a “blow-off” or “selling climax,” suggesting the trend is over.
- Watch the Breakouts: A breakout above a resistance level must be accompanied by a surge in volume; otherwise, it is likely a “bull trap.”
- Intermarket Context: Use intermarket analysis to see if volume increases are consistent across related sectors, which adds a layer of confirmation.
- Sentiment Check: Use the psychology of charting to understand that high open interest at market tops suggests late-comers are entering a crowded trade.
Case Studies in Market Strength
Case Study 1: The Crude Oil Reversal
In a historical analysis of the energy markets, Murphy noted a period where prices continued to climb while open interest began to decline steadily. This indicated that the rally was being fueled by shorts covering their positions rather than new buyers entering. Within weeks, the market peaked and entered a severe downtrend, validating the rule that price rising on falling OI is fundamentally weak.
Case Study 2: Crypto Breakout Validation
When backtesting Murphy’s strategies in Bitcoin markets, researchers found that breakouts from “Cup and Handle” patterns had a 70% higher success rate when volume on the breakout day was at least 50% higher than the 20-day moving average. This proves that classic volume principles remain highly relevant in modern, digital asset classes.
Conclusion
The “Murphy Approach” to volume and open interest provides a clear roadmap for distinguishing between healthy trends and deceptive price movements. By ensuring that volume validates price action and that open interest reflects genuine capital commitment, traders can significantly increase their win rates and avoid common market traps. To master these concepts as part of a holistic trading system, refer back to The Ultimate Guide to Technical Analysis of the Financial Markets by John Murphy, which remains the definitive resource for chartists worldwide.
FAQ: Volume and Open Interest
What is the main difference between volume and open interest?
Volume measures the total number of shares or contracts traded during a specific period, while open interest measures the total number of active contracts that remain “open” at the end of the day.
Why does John Murphy consider rising open interest bullish during an uptrend?
Rising open interest during an uptrend indicates that new buyers are entering the market and committing capital, which provides “fuel” for the trend to continue higher.
Can volume be used alone without price action?
No, Murphy emphasizes that volume must always be viewed in relation to price; volume tells you the intensity of the move, but price tells you the direction.
What does a “selling climax” look like on a chart?
A selling climax usually appears as a sharp price drop on exceptionally high volume, often following a prolonged downtrend, signaling that the last of the sellers have finally exited.
Are these principles still applicable to modern high-frequency trading (HFT)?
Yes, although HFT increases overall volume, the underlying principle that significant price moves require high relative participation remains a cornerstone of technical analysis.
How does open interest help in identifying market tops?
If prices are hitting new highs but open interest begins to level off or decline, it suggests the money flow is drying up, often signaling a market top is near.
Where can I learn more about these indicators in the context of Murphy’s work?
Detailed explanations of these relationships can be found in the comprehensive The Ultimate Guide to Technical Analysis of the Financial Markets by John Murphy.