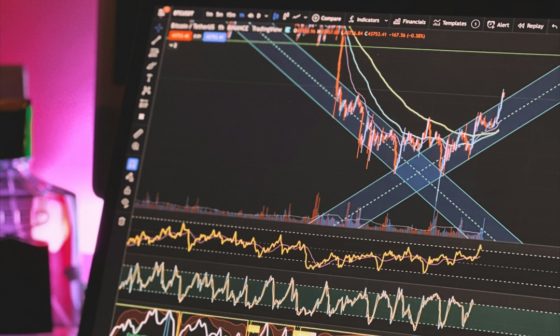

Navigating the complex landscape of aerospace and defense requires more than just a standard moving average or a basic Relative Strength Index (RSI). As we move toward 2026, the sector is being reshaped by rapid advancements in unmanned systems and artificial intelligence. To successfully trade these assets, sophisticated investors are increasingly relying on Custom Technical Indicators for Tracking Defense Industry Trends. These bespoke tools are designed to filter out market noise and focus specifically on the unique catalysts that drive defense equities—such as government procurement cycles, geopolitical tension escalations, and technological breakthroughs in autonomous warfare. Understanding these custom metrics is a vital component of The Ultimate Guide to Defense Tech Stocks 2026: Drones, USVs, and Autonomous Systems, providing a quantitative edge in a qualitatively driven market.
The Necessity of Specialized Indicators for Defense Stocks
Standard technical indicators were largely developed for the general equities market, where consumer sentiment and interest rates are primary drivers. However, the defense sector operates on a different frequency. Revenue is often “lumpy,” tied to multi-year government contracts rather than quarterly consumer sales. This creates a unique price action profile where traditional momentum indicators might give false signals during quiet procurement periods.
By developing Custom Technical Indicators for Tracking Defense Industry Trends, traders can account for the “Contract Lag” phenomenon. For instance, a custom indicator might weigh volume spikes differently when they coincide with Department of Defense (DoD) budget announcements. This specialized approach is particularly effective when Backtesting Momentum Strategies for Defense Sector ETFs, as it allows for a more nuanced view of sector-wide capital flows versus individual stock volatility.
Custom Indicator 1: The Defense Sentiment Momentum Oscillator (DSMO)
The DSMO is a proprietary framework that combines price momentum with a “Geopolitical Stress Index.” Unlike a standard oscillator that only looks at price, the DSMO tracks the rate of change in defense-specific news sentiment relative to historical volatility. When the DSMO diverges from the broader S&P 500 momentum, it often signals a “flight to safety” or an impending sector-specific rally triggered by global instability.
This indicator is exceptionally useful for those looking at Top 10 Drone Warfare Stocks Poised for Growth in 2026. Because drone manufacturers often trade on technical specs and test-flight successes, the DSMO can identify when a stock is being “bid up” by institutional insiders before a public contract award is officially announced.
Custom Indicator 2: The Unmanned Systems Adoption Ratio (USAR)
As the industry shifts from legacy platforms (like manned fighter jets) to autonomous systems, investors need a way to track this transition. The USAR is a custom technical indicator that measures the relative strength of a basket of autonomous tech stocks against legacy defense contractors.
By tracking this ratio, traders can identify structural shifts in the market. For example, if the USAR shows a bullish breakout while the overall aerospace sector is sideways, it indicates that capital is rotating specifically into Investing in Unmanned Surface Vessels (USV): A Deep Dive into Naval Tech. This allows traders to avoid the stagnation of older “prime” contractors and focus on high-growth disruptors.
Case Study: Custom Indicators in the USV Market
In early 2024, standard technicals for several naval tech companies showed a “neutral” trend. However, a custom indicator tracking “Sub-Sector Relative Strength” began to show significant bullish divergence. While the broader defense index was hampered by budget delays, the specific segment focused on Unmanned Surface Vessels was seeing a 20% increase in accumulation volume.
Traders who utilized these Custom Technical Indicators for Tracking Defense Industry Trends were able to enter positions in specialized USV firms three weeks before a major naval contract was announced. This case study highlights how Identifying Bullish Chart Patterns in Aerospace and Defense is more effective when those patterns are confirmed by sector-specific volume filters.
Integrating AI and Machine Learning into Custom Indicators
The most advanced custom indicators now incorporate elements of artificial intelligence to refine their signals. By using Custom Technical Indicators for Tracking Defense Industry Trends that are powered by ML models, traders can predict price floors based on historical “Defense Commodity” price correlations.
For instance, The Role of AI and ML Models in Modern Autonomous Weapon Systems extends beyond the battlefield and into the trading desk. These models can analyze thousands of previous geopolitical events to determine the likely duration of a volatility spike, helping traders choose the right How to Trade Defense Tech Options During Geopolitical Volatility strategies.
Case Study: Predicting Volatility in Autonomous Weaponry Stocks
Consider the “Autonomous Weapon Systems Companies” basket. In late 2025, a custom volatility-expansion indicator flagged an unusual contraction in the Bollinger Bands for the Top 5 Autonomous Weapon Systems Companies to Watch. Because this indicator was tuned to ignore standard tech market fluctuations and only trigger on “defense-relevant” volume, it provided a high-conviction signal.
When the expansion finally occurred, it was to the upside, correlated with a shift in NATO procurement priorities. Investors using standard indicators were often shaken out by the low-volume periods, whereas those using custom metrics held through the consolidation to capture a 40% move. This demonstrates the importance of The Psychology of Investing in Defense and Warfare Technologies—having confidence in your data allows you to manage the inherent stress of the sector.
Summary Table: Custom Indicators vs. Standard Indicators
| Indicator Type | Standard Metric (e.g., RSI) | Custom Defense Indicator | Primary Benefit |
|---|---|---|---|
| Momentum | Price change over time | DSMO (Price + Geopolitical Stress) | Filters out non-defense market noise. |
| Volume | Total shares traded | Contract-Weighted Volume | Identifies institutional “insider” accumulation. |
| Relative Strength | Stock vs. S&P 500 | USAR (Unmanned vs. Legacy Ratio) | Tracks the shift to autonomous technology. |
How to Implement These Indicators in Your Strategy
To begin using Custom Technical Indicators for Tracking Defense Industry Trends, traders should follow a structured approach:
- Identify Correlated Assets: Link your technicals to relevant commodities using Futures Trading Strategies for Defense Commodity Exposure.
- Define Event Triggers: Program your indicators to react differently during earnings vs. during national defense budget releases.
- Backtest with Sector Bias: Ensure your indicators are backtested against defense-specific cycles rather than general market cycles.
Conclusion
Developing and utilizing Custom Technical Indicators for Tracking Defense Industry Trends is no longer optional for serious investors in 2026. As the distinction between “tech” and “defense” continues to blur, specialized tools like the DSMO and USAR provide the necessary clarity to navigate high-volatility environments. By combining these custom technicals with the fundamental insights found in The Ultimate Guide to Defense Tech Stocks 2026: Drones, USVs, and Autonomous Systems, you can build a robust trading framework that captures the massive growth potential of the autonomous warfare revolution.
Frequently Asked Questions
What makes a technical indicator “custom” for the defense industry?
A custom indicator for defense typically integrates non-price data, such as geopolitical risk scores or government contract award frequencies, into a standard price/volume formula. This ensures the signal is relevant to the specific catalysts of the defense sector.
How can I track the shift from manned to unmanned systems using technicals?
You can use a “Relative Strength Ratio” between an index of drone/USV manufacturers and an index of traditional aerospace companies. A rising ratio indicates that the market is favoring autonomous tech over legacy platforms.
Do standard indicators like RSI work for defense stocks?
While RSI can show overbought or oversold conditions, it often fails in defense because these stocks can remain “overbought” for months during prolonged geopolitical conflicts. Custom indicators adjust for these extended trends.
Why is volume analysis different in the defense sector?
Volume in defense is often tied to institutional positioning ahead of budget cycles. Custom indicators look for “quiet accumulation”—high volume with minimal price movement—which often precedes major government contract announcements.
Can AI-driven indicators help with defense stock volatility?
Yes, AI-driven indicators can analyze historical “volatility clusters” related to global events, helping traders identify whether a price spike is a sustainable trend or a temporary reaction to news.
Are custom defense indicators better for short-term or long-term trading?
They are useful for both. Short-term traders use them for timing entries around geopolitical events, while long-term investors use them to identify structural rotations into new technologies like USVs and autonomous systems.
How do I start building my own custom defense indicators?
Begin by identifying the 3-5 external factors that most impact your defense portfolio (e.g., defense spending bills). Then, use a platform like TradingView or Python to create a script that modifies standard momentum indicators based on these factors.