Investing in the physical backbone of the energy transition requires more than just a long-term vision; it requires precision. As the global economy pivots toward cleaner energy, understanding The Role of Technical Indicators in Timing Entries for Infrastructure Stocks has become essential for investors looking to capitalize on the massive capital inflows expected through 2026. While fundamental analysis identifies which companies will benefit from government mandates, technical indicators provide the “when”—the specific entry points that maximize upside while minimizing exposure to the cyclical volatility inherent in heavy construction and industrial sectors. This guide is an integral component of The Comprehensive Investor’s Guide to Electric Grid Modernization and Smart Grid Stocks for 2026, designed to help you navigate the nuances of market timing in the infrastructure space.
The Importance of Momentum and Trend Confirmation
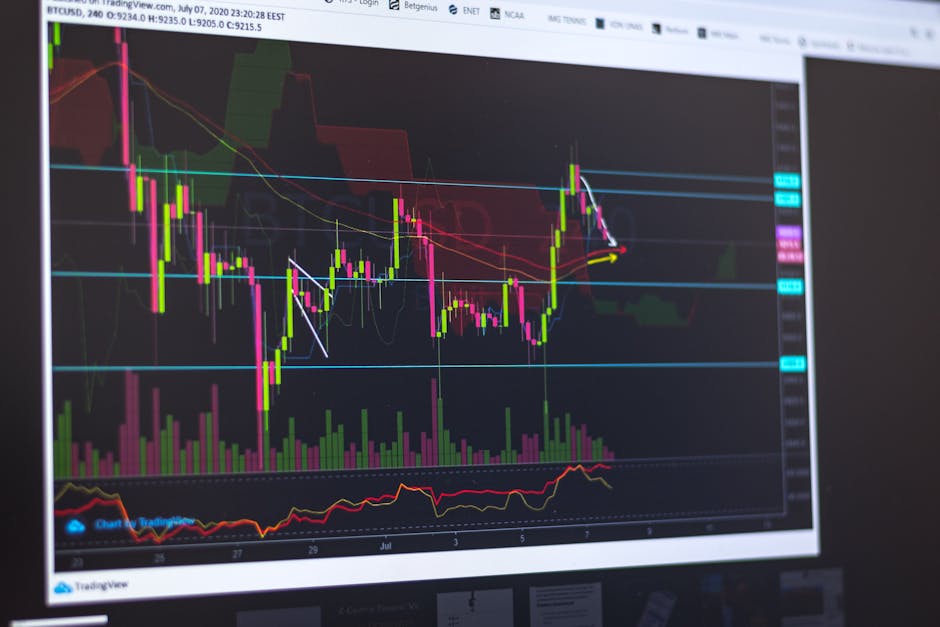
Infrastructure stocks, particularly those involved in Transmission Infrastructure Investing, often exhibit long-term trends driven by multi-year government contracts. However, these stocks can experience significant “shakeouts” during earnings season or policy shifts. Technical indicators like Moving Averages (MAs) serve as the first line of defense for the disciplined investor.
The 50-day and 200-day Simple Moving Averages (SMA) are the industry standards for determining the primary trend. For infrastructure players, a “Golden Cross”—where the 50-day SMA crosses above the 200-day SMA—often signals the beginning of a multi-quarter expansion phase. Conversely, because these companies are capital-intensive, a break below the 200-day SMA can indicate that rising interest rates or supply chain bottlenecks are starting to weigh on the sector’s profitability.
Relative Strength Index (RSI) and Overextension
In the lead-up to the 2026 grid upgrade cycle, many Top 10 Electric Grid Modernization Stocks Poised for Growth may become “crowded trades.” The Relative Strength Index (RSI) is an invaluable tool for identifying when an infrastructure stock has moved too far, too fast.
Typically, an RSI above 70 suggests a stock is overbought, while an RSI below 30 indicates it is oversold. In the infrastructure sector, however, strong momentum can often keep an RSI elevated for weeks. A more nuanced approach involves looking for “RSI Divergence”—where the stock price reaches a new high but the RSI makes a lower high. This often precedes a healthy correction, offering a more attractive entry point for those who missed the initial move. This is particularly relevant when Analyzing Candlestick Patterns in Leading Smart Grid Technology Equities, where price action and momentum must align to confirm a sustainable breakout.
Volume Profile and Support/Resistance Levels
Infrastructure stocks are often held by large institutional players. By analyzing volume, retail investors can see where the “big money” is placing its bets. In Investing in Power Grid Upgrades: Key Infrastructure Players, we often see significant volume clusters around specific price levels. These represent areas where institutions have historically accumulated shares.
When a stock like Quanta Services or Eaton approaches a historical resistance level on high volume, it suggests a breakout is imminent. If the breakout occurs on low volume, it may be a “bull trap.” For those utilizing Options Trading Strategies for Hedging Energy Sector Volatility, these volume-supported levels provide the ideal anchors for setting stop-losses or determining strike prices for covered calls.
Case Study 1: Timing the Breakout in Quanta Services (PWR)
In late 2023, Quanta Services, a leader in grid infrastructure, showed a classic “cup and handle” pattern—a bullish continuation sign. While the fundamental story of grid modernization was well-known, the technical entry was triggered when the price cleared the $200 resistance level on 150% of its average daily volume. By waiting for this technical confirmation, investors avoided the dead-money period during the six-month consolidation phase, capturing the rapid ascent that followed as the 2026 Grid Upgrade Cycle began to be priced in by the market.
Case Study 2: Utilizing the 200-Day SMA for ETF Entry
For many, the Best Grid Technology ETFs to Diversify Your Portfolio offer a safer way to play the sector. In 2024, the First Trust Nasdaq Clean Edge Smart Grid Infrastructure Index Fund (GRID) experienced a 10% pullback. While headlines were bearish, the price found perfect support at the 200-day SMA. A technical entry at this “mean reversion” point allowed investors to buy the dip in a secular bull market, using the moving average as a clear floor for risk management.
The Role of MACD in Trend Reversals
The Moving Average Convergence Divergence (MACD) is a trend-following momentum indicator that shows the relationship between two moving averages of a stock’s price. For companies specializing in Smart Grid Stocks 2026 and AI-driven distribution, the MACD can help identify the end of a corrective phase. A “MACD Bullish Crossover” occurring below the zero line is often one of the most reliable signals that a downtrend has exhausted itself and a new upward leg is beginning.
Integrating Technicals with a Backtesting Strategy
No indicator is foolproof. This is why a rigorous Backtesting Strategy: Evaluating Grid Modernization Stocks Over the Last Decade is vital. Historical data shows that in the infrastructure sector, combining the RSI with volume confirmation yields a higher win rate than using either indicator in isolation. For the 2026 cycle, investors should look for “confluence”—where multiple indicators (e.g., a bounce off the 50-day SMA, a bullish MACD cross, and an RSI coming out of oversold territory) all signal an entry simultaneously.
Conclusion: Mastering the Entry for 2026
In the complex world of infrastructure investing, fundamental analysis tells you what to buy, but technical analysis tells you when to buy. By mastering The Role of Technical Indicators in Timing Entries for Infrastructure Stocks, you can navigate the volatility of the energy transition with confidence. Whether you are tracking moving averages to confirm a trend or using RSI to avoid overextended rallies, these tools are essential for optimizing your portfolio’s performance. As we approach the massive upgrade cycle of 2026, remember that discipline in timing is just as important as the selection of the stocks themselves. For a broader perspective on the fundamental drivers of this sector, refer back to The Comprehensive Investor’s Guide to Electric Grid Modernization and Smart Grid Stocks for 2026.
Frequently Asked Questions
1. Why are technical indicators specifically important for infrastructure stocks compared to tech stocks?
Infrastructure stocks are highly sensitive to capital expenditure cycles and interest rate changes, leading to long periods of consolidation followed by sharp moves. Technical indicators help identify when these consolidation phases are ending, preventing investors from tying up capital in “dead money” for years.
2. Which moving average is most reliable for timing entries in the smart grid sector?
The 200-day Simple Moving Average (SMA) is widely considered the most reliable “institutional floor.” For faster-moving smart grid stocks that integrate AI and software, the 50-day EMA (Exponential Moving Average) often provides more timely signals for momentum entries.
3. How does volume analysis help in infrastructure investing?
Since infrastructure projects involve massive contracts, stock movements are often driven by institutional accumulation. High volume on a price breakout confirms that “smart money” is entering the position, providing a more reliable signal than price movement alone.
4. Can I use the same technical indicators for infrastructure ETFs as I do for individual stocks?
Yes, but with a caveat: ETFs like GRID or XLU are less volatile than individual stocks. Therefore, indicators like the RSI may not reach extreme levels as often, making small “ticks” above 40 or below 60 more significant than they would be for a single high-beta stock.
5. How do I avoid “false breakouts” when using technical indicators for these stocks?
Look for “confluence,” which is the alignment of two or more indicators. For example, only enter a trade if the price breaks a resistance level and the MACD shows a bullish crossover simultaneously, while ensuring the RSI is not yet in overbought territory.
6. How will the 2026 upgrade cycle affect technical patterns in this sector?
As we approach 2026, we expect increased volatility and “blow-off tops” as the theme becomes more mainstream. Technical indicators will be crucial for identifying these parabolic moves and providing exit signals before the inevitable “sell the news” event occurs.
7. What role do candlestick patterns play alongside technical indicators?
Candlestick patterns provide a visual representation of market psychology at key levels. For instance, a “Bullish Engulfing” pattern at a 200-day SMA support level offers a high-probability entry signal that confirms the technical indicator’s data.