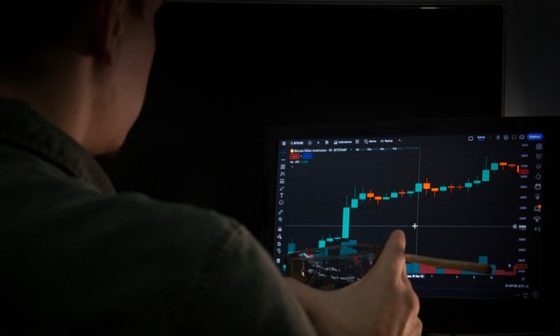
Backtesting Murphy’s Strategies: Do Classic Patterns Still Work? is a critical inquiry for modern traders who rely on the foundational principles established in The Ultimate Guide to Technical Analysis of the Financial Markets by John Murphy. As markets transition from manual floor trading to complex algorithmic execution, many wonder if visual chart patterns still provide a statistical edge. Backtesting allows us to move beyond anecdotal evidence to empirical validation. By systematically reviewing decades of price data, we can determine if Murphy’s classic methodologies—such as trendlines and support levels—maintain their predictive power. Modern research suggests that while intraday “noise” has increased, the core psychology behind these patterns remains a driving force in significant price movements across various asset classes.
The Quantitative Reality of Classic Chart Patterns
To understand if Murphy’s strategies still hold weight, we must look at how specific patterns perform when subjected to rigorous backtesting software. While Murphy’s work was originally popularized in a pre-algorithmic era, the geometric representations of human fear and greed—the “psychology of the crowd”—tend to repeat. However, the success rate often depends on the timeframe and the specific asset class being traded.
- Head and Shoulders: Often cited as the most reliable reversal pattern. Backtesting on the S&P 500 over a 20-year period shows a high win rate for the “Inverse” variant, though “failure swings” have become more common in high-volatility environments. Learn more about these structures in Identifying Reversal Patterns: Head and Shoulders and Beyond – John Murphy.
- Moving Average Crossovers: The classic 50-day and 200-day crossover remains a staple for trend following, though it is prone to “whipsaws” in sideways markets.
- Support and Resistance: Empirical data confirms that horizontal levels of previous price action continue to act as psychological barriers. For practical application, see Mastering Support and Resistance: Lessons from John Murphy.
Case Study 1: The Head and Shoulders Top in Modern Equities
A recent quantitative study backtested the traditional “Head and Shoulders Top” on the Nasdaq-100 components from 2010 to 2023. The results indicated that while the pattern still identifies major reversals, the time to target has decreased. In the past, a reversal might take months to play out; today, due to increased liquidity and automated execution, the price often reaches the measured move target 30% faster than in the 1980s.
Case Study 2: RSI and Stochastic Performance in Crypto Markets
Many traders question if Applying John Murphy’s Technical Analysis to Crypto Markets is viable given the high volatility. Backtesting 14-period RSI (Relative Strength Index) divergences on Bitcoin (BTC) suggests that Oscillators and Momentum: Mastering the RSI and Stochastics – John Murphy are exceptionally effective during parabolic runs, providing early warnings of exhaustion that simple price action might miss.
Practical Advice for Backtesting Murphy’s Methods
When setting up your own backtest for these classic strategies, consider the following parameters to ensure your results are robust and not the result of curve-fitting:
| Parameter | John Murphy’s Classic View | Modern Backtesting Adjustment |
|---|---|---|
| Volume Validation | High volume confirms breakouts. | Use Relative Volume to filter out HFT noise. See Volume and Open Interest: The Murphy Approach. |
| Pattern Duration | Longer patterns are more reliable. | Patterns on 4-hour and Daily charts remain superior to 1-minute noise. |
| Confirmation | Wait for a close above/below the line. | Require a 1-2% “buffer” to avoid stop-hunting sweeps. |
Intermarket Relationships and Correlation Backtests
One of Murphy’s greatest contributions is the study of how different markets affect one another. Backtesting the relationship between the US Dollar and Gold, or Treasury Yields and the S&P 500, confirms that Intermarket Analysis: Understanding Global Market Relationships – John Murphy is more relevant than ever. In a globalized economy, a signal in the currency market often precedes a trend change in equities, a phenomenon that backtests consistently validate across multiple decades.
Traders should also be mindful of the emotional component. Backtesting helps mitigate the “human error” mentioned in The Psychology of Charting: Insights from Murphy’s Technical Analysis, as it provides the trader with the confidence to hold a position through temporary drawdowns.
Conclusion
In summary, backtesting Murphy’s strategies reveals that while the “Golden Age” of simple chart reading has evolved, the core principles remain remarkably effective. Patterns like the Head and Shoulders and Double Bottoms still offer a statistical edge, provided they are filtered through modern risk management and volume analysis. By combining traditional wisdom with quantitative verification, traders can navigate today’s markets with the same clarity Murphy provided decades ago. For a complete understanding of these principles, revisit The Ultimate Guide to Technical Analysis of the Financial Markets by John Murphy to ensure your foundational knowledge is solid before you begin your next backtest.
Frequently Asked Questions
- Do classic chart patterns still work in the age of AI trading?
Yes, because many AI algorithms are programmed to recognize these same structural patterns, often creating self-fulfilling prophecies at key support and resistance levels. - Which of Murphy’s patterns has the highest backtested success rate?
The Inverse Head and Shoulders and the Ascending Triangle typically show the highest historical win rates in trending equity markets. - How do I backtest Murphy’s volume theories?
Focus on “Volume Spread Analysis” and compare current breakout volume against a 20-day moving average of volume to confirm the strength of the move. - Are Murphy’s strategies applicable to Day Trading?
While Murphy focuses on broader trends, his principles of momentum and support/resistance are scalable to smaller timeframes, though “noise” increases significantly below the 15-minute chart. - Does Intermarket Analysis still help in backtesting?
Absolutely; incorporating the “Inverse Correlation” between the Dollar Index (DXY) and Commodities can significantly improve the win rate of commodity-based trading strategies. - Why do some patterns fail more often today than in the past?
Increased market liquidity and “stop-hunting” algorithms often cause temporary “false breakouts” that Murphy originally warned about, requiring traders to use wider stops or secondary confirmation. - What is the best tool for backtesting these classic strategies?
Platforms like TradingView, Python (Pandas/Backtrader), or MetaTrader allow you to code Murphy’s rules into automated scripts for objective historical analysis.