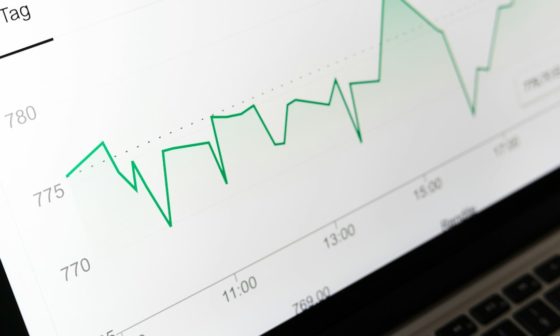
Understanding the Kaufman Adaptive Moving Average (KAMA) for Dynamic Markets is a critical skill for any systematic trader looking to minimize lag while reducing false signals. Featured prominently in The Definitive Guide to Trading Systems and Methods by Perry J. Kaufman, KAMA utilizes an Efficiency Ratio to measure price noise. By dynamically adjusting its smoothing constant, KAMA remains highly responsive during strong trends but stays flat during choppy, lateral price action. This adaptive nature makes it superior to traditional EMAs or SMAs, which often suffer from significant lag or excessive whipsaws in volatile conditions, providing a foundation for Trend Following Strategies and sophisticated market timing.
Validate your Kaufman Adaptive Moving Average strategy with comprehensive backtesting
Backtest Kaufman Adaptive Moving AverageHow KAMA Solves the Volatility Dilemma
Traditional moving averages use a fixed look-back period, which forces traders into a compromise: use a short period for speed (and risk whipsaws) or a long period for stability (and risk late entries). KAMA solves this by incorporating Market Efficiency. When the market moves predictably, the Efficiency Ratio (ER) increases, speeding up the KAMA. Conversely, in “noisy” markets, the ER drops, and the KAMA slows down, effectively filtering out minor price fluctuations.
This methodology is closely tied to Market Efficiency and the Adaptive Nature of Trading Strategies – Perry J. Kaufman. By making the indicator adaptive, traders can achieve better Robustness Testing and avoid the pitfalls of over-optimization, as discussed in Robustness Testing: How to Avoid Over-Optimization in Trading Systems: Lessons from Perry J. Kaufman.
Practical Implementation and Case Studies
To implement KAMA effectively, traders usually focus on three parameters: the ER period (often 10), the fastest EMA constant (often 2), and the slowest EMA constant (often 30). This allows for deep customization in different asset classes.
- Case Study 1: The S&P 500 Bull Run – During consistent uptrends, KAMA acts as a tight trailing stop. Unlike a standard SMA-50, which might sit far below price, KAMA tracks the trend closely, allowing for higher profit retention when the trend finally breaks.
- Case Study 2: Cryptocurrency Volatility – In markets like Bitcoin, where “noise” is extreme, KAMA often remains horizontal during consolidation phases. This prevents trend-following systems from entering “false-breakout” trades that would otherwise be triggered by a standard EMA.
- Case Study 3: Mean Reversion in Forex – While KAMA is a trend tool, its “flatness” during sideways markets serves as an excellent filter for Mean Reversion Trading Systems, indicating when the market lacks a clear directional bias.
Integrating KAMA into a Systematic Framework
KAMA is rarely used in isolation. It functions best when integrated into a broader strategy that includes Portfolio Diversification and Risk Control. Traders should also apply Advanced Backtesting Metrics to ensure the adaptive parameters hold up across different market regimes, including Futures and Options Markets.
For those interested in the future of technical analysis, the logic behind KAMA’s adaptive smoothing is a precursor to The Role of Machine Learning in Modern Trading Systems, where algorithms dynamically recalibrate based on evolving data patterns.
Conclusion
Understanding the Kaufman Adaptive Moving Average (KAMA) for Dynamic Markets allows traders to bridge the gap between responsiveness and reliability. By filtering noise through the Efficiency Ratio, KAMA provides a sophisticated alternative to static indicators. Whether you are focusing on Systematic Trading vs. Discretionary Trading, KAMA offers a mathematically sound way to navigate volatility. For a deeper dive into these methodologies, refer to the comprehensive resources in The Definitive Guide to Trading Systems and Methods by Perry J. Kaufman.
FAQ: Understanding the Kaufman Adaptive Moving Average (KAMA)
1. What makes KAMA different from a standard Exponential Moving Average (EMA)?
Unlike an EMA, which uses a fixed smoothing factor, KAMA changes its smoothing speed based on the Efficiency Ratio of price movement. It speeds up when prices trend cleanly and slows down during market noise.
2. How is the Efficiency Ratio (ER) calculated in KAMA?
The ER is calculated by dividing the total price change over a period by the sum of the absolute individual price changes (volatility) during that same period. A value near 1 indicates a strong trend, while a value near 0 indicates noise.
3. Can KAMA be used for short-term day trading?
Yes, KAMA is highly effective for day trading because it filters out the “micro-noise” of intraday price action, though users should calibrate the fast and slow constants to match the specific asset’s intraday volatility.
4. How does KAMA contribute to system robustness?
KAMA contributes to robustness by reducing the need for constant manual adjustments to look-back periods. Its adaptive nature allows it to perform consistently across different market cycles without over-optimization.
5. Is KAMA better for trend following or mean reversion?
KAMA is primarily a trend-following tool designed to identify the start and end of trends. However, its ability to go “flat” in non-trending markets makes it an excellent filter for mean reversion entries.
6. Does Perry J. Kaufman recommend KAMA for all asset classes?
In his guide, Kaufman demonstrates KAMA’s utility across futures, equities, and currencies, highlighting that its adaptive logic is universal to any market exhibiting varying levels of noise and trend.
7. What are the ideal settings for KAMA?
While “ideal” settings depend on the strategy, the standard default is often a 10-period ER, a fast 2-period EMA, and a slow 30-period EMA, as suggested in Kaufman’s core research.